Why is increasing visitor numbers not enough?
A marketing team may celebrate rising traffic while sales notices that new buyers do not return and support receives questions that could have been answered before purchase. These are not necessarily three separate problems. An advertisement might attract people the product does not suit, a landing page might promise something the experience does not deliver, or a sale might close before the customer understands how to benefit. If we focus only on traffic, we will buy more movement into a journey whose friction we have not located.
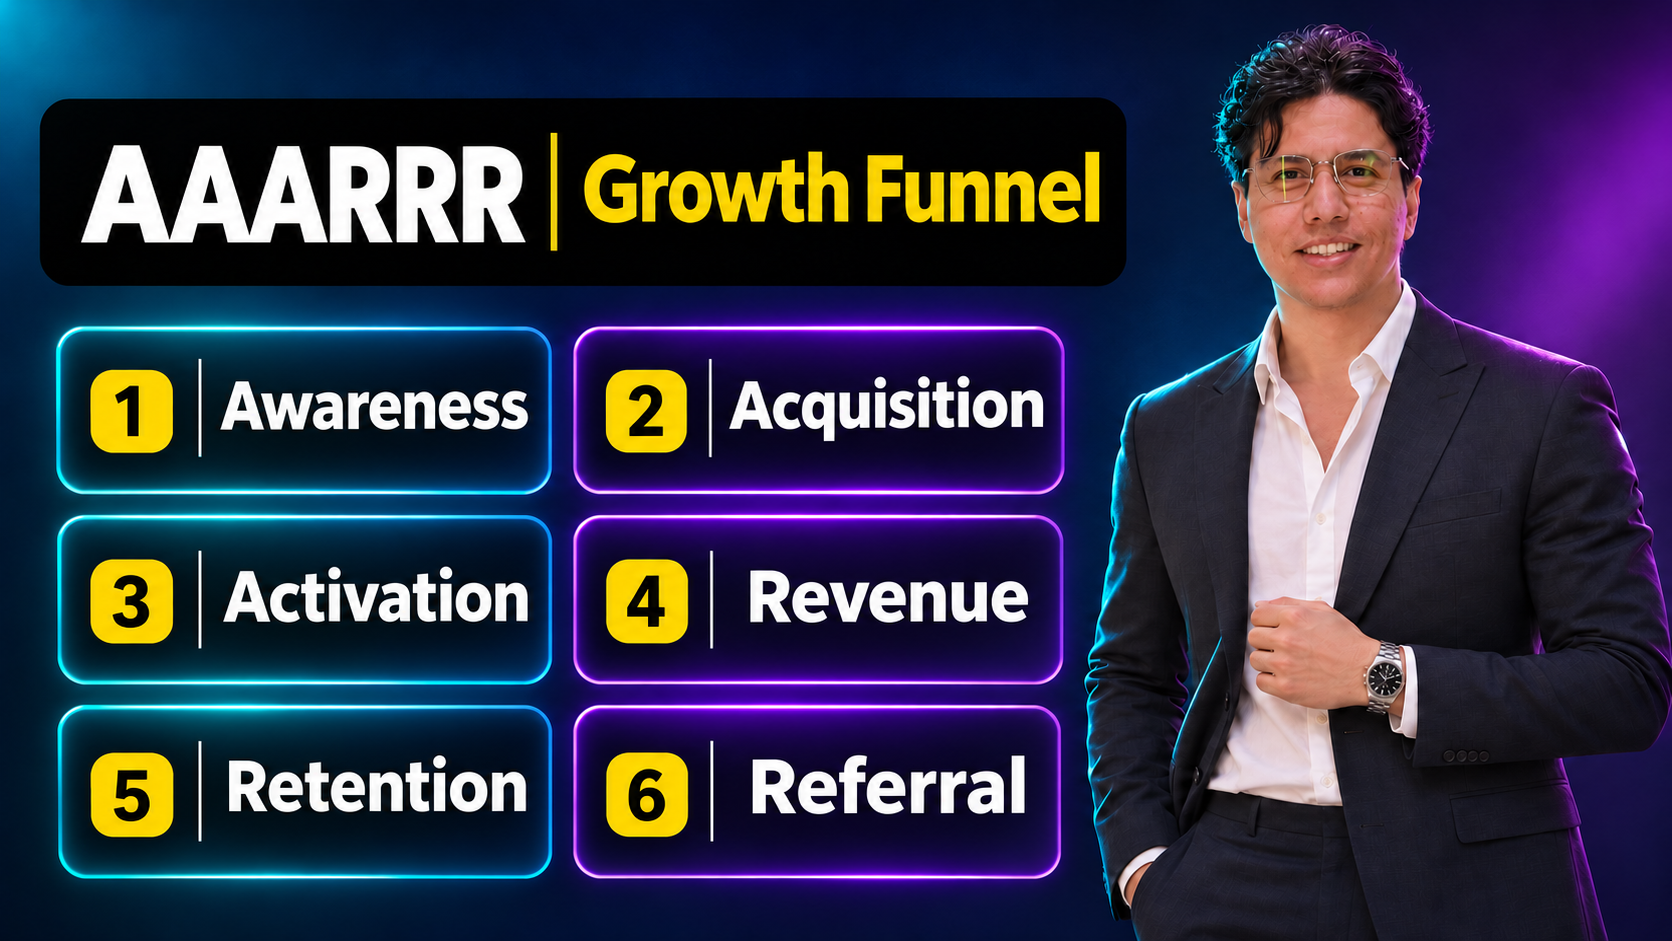
The AAARRR funnel organizes that journey into six stages that can be discussed and measured: awareness, acquisition, activation, revenue, retention, and referral. Its value is not in reducing people to numbers or imposing one route on everyone, but in connecting marketing with customer experience and commercial outcomes. When the team agrees on each stage's meaning, it can ask a practical question: do we need a new audience, a better first experience, or a stronger reason to return? The answer changes where money and effort go instead of repeating the same solution for every problem.
The model's definition and the source's limits
This lesson draws on physical page 24 of the approved course file “Digital Customer Experience: Arabic Explanatory Notes.” The source presents this exact sequence: Awareness, Acquisition, Activation, Revenue, Retention, and Referral. We retain that order because other explanations use different funnel versions or place retention before revenue. A different order does not mean every business journey must match the diagram. It does mean we should name the version we are using rather than mix similar frameworks together.
The first three words begin with A and the final three with R. This is therefore a six-stage model, not a five-stage abbreviation given a new name. We do not attribute the invention of this version to a particular person without evidence from the source. The explanation, examples, and exercises below are original practical development of the educational structure, not quotations of real project results. Every commercial number in the two examples is hypothetical, intended to teach definition, calculation, and decision-making rather than provide a market benchmark.
Read the map as a diagnostic tool, not a law of movement
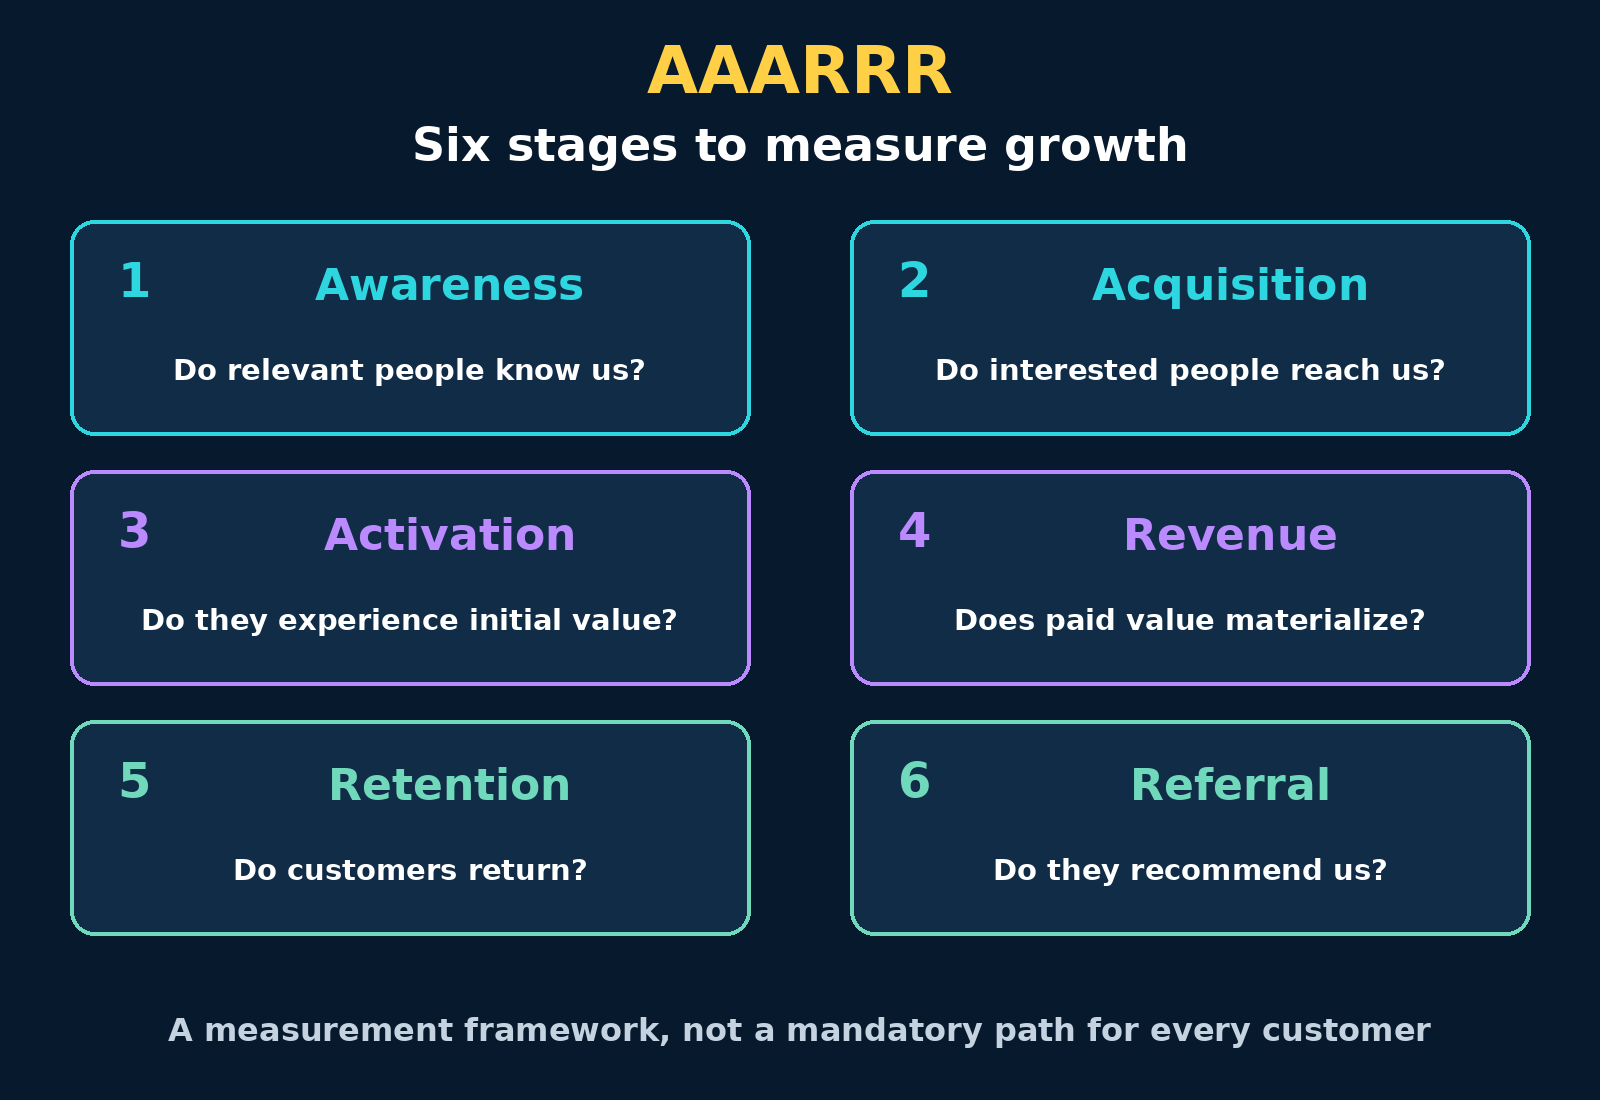
The diagram starts with awareness because someone needs to recognize the problem, solution, or brand. It then shows movement toward an observable visit, a meaningful first action, a purchase, an ongoing relationship, and a recommendation to others. But an existing customer may buy directly, someone may refer another person before becoming a buyer, and a free product may need substantial retention before revenue. We retain the course sequence for explanation while recording actual routes in analysis instead of deleting them because they do not fit the picture.
Nor does each stage's area in the drawing represent a measured proportion or imply that every business must lose a fixed number of people between stages. Compare comparable groups over appropriate periods; do not divide counts belonging to different audiences. Advertisement impressions on a platform, registered accounts in a system, and paid invoices are not automatically equivalent units. Before drawing a numerical funnel, explain whether you are measuring people, sessions, accounts, or orders, how those units connect, and what you cannot connect.
Awareness: does the audience understand why it should care?
At the awareness stage, someone learns about the brand, category, or problem the offer addresses. The task is not simply to repeat a name, but to build an understandable connection between a genuine need and what you can provide. Educational content, search visibility, a suitable partnership, or an advertisement explaining a familiar situation may help. Choose the message around the audience's question, and do not use attention as an excuse to exaggerate promises, frighten people, or conceal service limitations.
Separate exposure from understanding. Impressions report displays, and reach estimates a unique audience under the platform's definition, but neither proves that someone remembered or believed the message. You might add a limited recall or awareness survey or monitor branded searches while recognizing other influences. Do not add the reach of two platforms as though the people are distinct without removing overlap. When measurement is incomplete, show separate signals instead of inventing a precise rate connecting awareness to every purchase.
Acquisition: from exposure to a suitable visit
Acquisition here means attracting a new visitor to a destination where you can serve them, such as a website, application, or product page. Visits are not equally valuable opportunities. A visit from a country the service does not cover, or from someone expecting something different because an advertisement was ambiguous, may inflate the report and increase disappointment. Define a qualified visit before comparing channels: which regions are served, what need is relevant, which page is intended, and what signals are sufficient without collecting unnecessary personal information?
Review consistency between the channel's promise and the landing page, mobile usability, clear language, and how quickly essential information appears. Cost per qualified visit can be calculated by dividing attributed campaign expenditure by its qualified visits, but that is not the cost of acquiring a paying customer. Give every metric an accurate name. If your organization defines acquisition differently, such as account creation, explain the distinction in the measurement dictionary so two teams do not compare figures with the same label but different underlying events.
Activation: a first action showing the beginning of value
The course material describes activation as a visitor taking a first action. To apply that usefully, choose an action connected with understanding or experiencing the offer's value, rather than any click you can record. In an invoicing tool it might be completing a first valid trial invoice; in a shop it might be using a sizing guide and saving a suitable choice. No single definition works for every business. What matters is explaining why the event indicates meaningful progress and testing its relationship with later outcomes rather than assuming that relationship.
A prominent button may increase registered accounts without improving the first experience. Track time to the meaningful action, errors that obstruct it, requests for help, and the proportion completing it within a stated period. Ask users who stopped what they did not understand instead of merely guessing that price is the problem. Sometimes the solution is a ready-made example, clearer instructions, or removal of a repeated step rather than a discount. Activation should never become an excuse to push users into an action they do not need or consent they do not understand.
Revenue: when did a purchase actually happen?
The revenue stage asks whether use or interest becomes a purchase or a paid commercial outcome. Start by defining the event: an order created, a successful payment, a completed service, or money collected after the cancellation window? All these events can be tracked, but they should not be interchangeable. Distinguish order value, accounting revenue, margin, and cash flow as well; recognizing revenue may require accounting treatment different from a marketing dashboard. Agree on terminology with the financial owner before using it in a formal report.
Read volume, value, and quality together. More buyers may result from discounts that consume margin, while a higher average order may conceal fewer customers. Show cancellations, refunds, and the fulfillment costs relevant to the comparison, and do not call every payment receipt profit. In subscriptions, distinguish first payment, renewal, and customers who have stopped. The goal is not to force the revenue stage upward by any means, but to build an exchange the business can sustain and in which customers find clear value and truthful information.
Retention: an appropriate return after the first experience
Retention means an ongoing relationship or a return to meaningful use within a period suited to the product. Do not treat a login alone as success if the user returns to resolve an unresolved problem. Nor is a month without purchase necessarily a lost customer for something bought annually. Choose behavior that reflects continuing value, such as completing a core task again or voluntarily renewing a subscription. Set the measurement period according to the expected usage pattern and maintain it when comparing groups.
Begin improvements with experience quality: does the customer receive what they bought, know how to use it, and have easy access to support and cancellation? Reminders can help when expected, appropriate, and covered by valid consent, but they do not compensate for an unsuitable product. Analyze customers by starting date, segment, or acquisition channel rather than mixing new customers who have not had an opportunity to return with older cohorts. Show discontinuation or complaints alongside retention so forced lock-in does not look like a successful relationship.
Referral: a genuine recommendation, not merely a link
Referral means a customer recommending the brand to others. It may happen in a private conversation you cannot observe, through a sharing link, or through a transparent program offering a disclosed benefit to both parties. Distinguish the opportunity to share, an invitation sent, a new person's arrival, and that person's conversion to a customer. Copied links are not persuasive recommendations, and invitees are not new buyers. Choose the metric that answers your question and name the intermediate stages rather than merging them into an attractive figure.
Do not request access to customers' contacts merely to make growth easier, and do not send messages on their behalf without clear authorization. If there is an incentive, make its terms and benefit visible and monitor duplicate accounts, fraud, and cost. Do not treat referral as a guaranteed consequence of retention either: someone may remain with a good service without wishing to recommend it. Ask respectfully about barriers, make sharing optional, and focus first on an experience worth talking about.
Who owns the funnel? Shared responsibility with named owners
The course diagram connects the first two stages with the marketer and later stages with growth work, while explaining that all of them belong within marketing. This educational distinction should not become an organizational barrier. An excellent advertisement cannot fix broken payment, and a product team cannot independently repair expectations created by exaggerated advertising. Assign an owner to each transition and identify the support, data, and operations colleagues needed, so “that is not my responsibility” does not become a permanent source of lost opportunities.
Use a short meeting to review the problem rather than a competition to present the largest figures. Start with a specific event, evidence of the problem's size, a testable hypothesis, and a decision on the owner and review date. For example, users start an invoice but stop at an unclear tax field; the hypothesis is that an explanatory example will reduce errors. Coordination then centers on customer experience instead of each team requesting more budget before discovering what obstructs the journey.
Build a measurement dictionary before a dashboard
For each stage, write down the event definition, counting unit, denominator, period, data source, exclusions, and definition owner. For activation, the unit might be a new account, the event a first valid trial invoice within seven days, and the denominator all eligible accounts whose registration is at least seven days old. Exclude test and employee accounts under a declared rule, and do not change exclusions after seeing the result. Record any definition change because old and new comparisons may need recalculation.
Test measurement in practice before interpreting it: complete a trial journey and check that refreshing the page does not duplicate events, failed payments and refunds are handled, and timestamps and time zones align. Do not put email addresses or telephone numbers in public tracking URLs or collect sensitive details you do not need. If platforms cannot be linked, disclose the unobserved portion rather than guess its attribution. Missing data is a measurement problem to address, not proof that people did not move or a channel had no influence.
Hypothetical example one: an invoicing tool for small businesses
Consider a monthly subscription tool for small-business owners. During one month, its campaign recorded 100000 impressions within one platform and brought 4000 qualified new visitors to the website. Of these, 800 created trial accounts, 400 accounts completed a first valid invoice within seven days, and 120 paid for their first subscription month. Here acquisition means a visit and activation means completing the invoice. Account creation remains an additional diagnostic step, not a seventh stage in the model.
Account creation from qualified visits is 800 ÷ 4000 = 20%. Activation among registered accounts is 400 ÷ 800 = 50%, whereas activation from visitors is 10%. Conversion to payment among activated accounts is 120 ÷ 400 = 30%, and from all visitors it is 3%. These rates are valid assuming the events belong to the same group within mature measurement windows. We do not divide visitors by impressions and call the result a people-based transition rate from awareness, because the counting units differ.
At a subscription price of 100 Saudi riyals, first-month payment value is 120 × 100 = 12000 Saudi riyals before refunds, costs, or accounting treatment. If campaign expenditure was 6000 Saudi riyals and these customers were attributed to it under a defined rule, paying-customer cost from that expenditure is 50 Saudi riyals. That is not total customer acquisition cost if staff pay or other costs are absent. After every subscriber has had a full month, 90 renew, giving this cohort a renewal rate of 90 ÷ 120 = 75%.
Of those renewed customers, 18 voluntarily shared a referral link, generating 36 new visitors, of whom 6 later paid. Participation among renewed customers is 20%, and referral-visit conversion to payment is approximately 16.7%. We do not add those six to the original 120 when evaluating payment in the original cohort, because they belong to a later group. Nor do six cases establish that referral is always the better channel; the sample is small and needs follow-up. Use the findings to choose a next question, such as why half of registered accounts stop before their first invoice.
Test one improvement without turning an assumption into a promise
Suppose interviews and error logs point to unclear invoice setup. A ready-made template and short instructions could be tested under the hypothesis that they increase activation without increasing errors or support requests. Arithmetically, if activation rises from 50% to 60% among 800 accounts, the number becomes 480 instead of 400. If conversion to payment remains 30%, the scenario produces 144 payers instead of 120, or 24 additional payers. This is a sensitivity calculation, not an established result or guaranteed forecast.
Define success, duration, and harm indicators before testing, and do not stop at the first positive-looking day. Where possible, compare randomly assigned groups during the same period and check that users do not move between treatments. With small volumes, collect qualitative evidence and disclose inference limits rather than claim statistical significance. Activation might improve while attracting people less ready to pay, invalidating the 30% assumption. Monitor later stages after their windows mature before rolling out the change.
Hypothetical example two: a health service and marketing boundaries
Page 25 of the material presents a healthcare journey labeled awareness, consideration, decision, experience, and retention. That is a different journey, not a literal presentation of AAARRR's six stages. We use an original example to show how a healthcare team can organize measurement without conflating the journeys or turning care into a race to increase visits. In healthcare, clinical appropriateness, privacy, and clear information come first. Demand for unnecessary care must not be treated as a desirable marketing outcome.
Suppose an information page describes an available service appropriate for a defined group and receives 1000 qualified visitors over a completed period. Of these, 200 submit an appointment request, 160 bookings are confirmed, and 120 appointments are attended after all booking dates have passed. Activation can mean submitting a complete, understood request, with confirmation and attendance tracked as later steps. Request rate from visits is 20%, confirmation from requests is 80%, and attendance from confirmed bookings is 75%. A request is not successful treatment, attendance is not improved health, and financial value is not evidence of care quality.
If a clinician recommends appropriate follow-up for 80 people and 60 complete it within the specified window, follow-up completion among eligible people is 75%. Do not divide 60 by all visitors or classify people not advised to return as lost customers. Authorized reminders and clearer location details and instructions may help, but health-condition data should not be used in advertising targeting or public links. A patient's unwillingness to refer others or write a public review is not failure either; privacy may matter more to them than sharing.
How do you choose the bottleneck worth addressing?
Do not automatically choose the smallest percentage. Purchase may be low because the product is expensive and the decision cycle long, while reducing cancellations of confirmed orders may have the greatest practical impact. Combine four questions: how large is the opportunity, how strong is the evidence of its cause, what does a fix cost, and can operations serve the result if it succeeds? Compare potential impact within explicit limits, and do not multiply funnel percentages together when they belong to different groups or periods.
When performance declines, separate changing audience mix from changing experience. A larger share of unfamiliar new visitors may lower the overall average even if performance within every segment is stable. Devices, country mix, or price may also have changed. Review measurement first, segment only as far as sample size permits, and talk to customers. Fine segmentation should not become a way to discover an appealing story in sparse noise: record a new hypothesis and test it on later data rather than declare it a settled fact.
A weekly review that protects decisions from haste
At the start of each review, ask whether every cohort's measurement window is complete. If activation is defined within seven days, do not classify a two-day-old account as a failure. If renewal occurs after a month, do not compare a mature cohort with one still in its first week. Show immature counts separately and specify when they will be reviewed again. This simple detail prevents costly decisions, such as stopping a good channel because its new customers have not yet had enough time to complete the journey.
Then review three layers of evidence: was the event recorded correctly, did customer behavior actually change, and did the change benefit the business? Activation may change because engineering fixed a duplicated event, not because users became less active. Purchases may rise after a temporary offer and then produce more refunds. A short dated annotation explaining measurement, price, or operational changes makes a report understandable and prevents every increase from being attributed to the latest campaign.
Finally, record the resulting decision, not just the figures. State what will continue, what will stop, and what evidence is needed before expanding the experiment. With insufficient data, the correct decision may be ten focused interviews or fixing payment tracking rather than launching another test on broken measurement. Keep a record of unsuccessful hypotheses so the team does not repeat the same experiment a month later under a different name. The funnel then becomes a shared learning record rather than a periodic presentation whose value ends with the meeting.
Practical exercise: a one-page map
Choose one product, one segment, and an appropriate measurement period. Write the six stages in order, then place under each one the customer's question, observable behavior, one main metric, and a quality indicator that protects it. Add each metric's denominator, data source, and responsible owner. If a stage cannot currently be measured, write “currently unavailable” and identify a reasonable way to gather evidence instead of entering zero or copying a platform metric that measures something else.
Next, choose one transition to improve and state a hypothesis in one sentence: we believe a specified change will help a specified audience complete a specified action, and we will check using a defined metric and period. Write down what would make you reject the hypothesis and how complaints, cancellation, or team workload will be monitored. Ask a colleague to recalculate the rates from the original counts and explain them in their own words. If you disagree about the denominator or activation's meaning, fix the definition before designing a beautiful dashboard or increasing expenditure.
Common mistakes worth a final check
Recurring errors include calling every visit a customer acquisition, treating registration as activation without testing value, confusing payments with profit, and comparing retention in groups with unequal observation time. Others include imposing the diagram's order on a complex journey, treating referral as a customer's obligation, or hiding refunds to show more attractive growth. Review these points before presenting the report: a mathematically correct number can still mislead if its label, denominator, or context is wrong.
The practical conclusion is that AAARRR gives a team a shared language for questions, not ready-made answers. Use awareness to understand message exposure, acquisition for visit quality, activation for the beginning of value, revenue for commercial exchange, retention for continuing benefit, and referral for voluntary recommendation. Connect measurement to a small decision that can be reviewed. Success is not making every dashboard cell green, but understanding what customers need, removing obstacles to benefit, and maintaining an experience the business can deliver honestly and sustainably.
Frequently asked questions
What are the AAARRR stages in this lesson?
Awareness, Acquisition, Activation, Revenue, Retention, and Referral. This is the sequence shown on page 24 of the digital customer experience material, while recognizing that actual movement may return to or bypass some steps.
Does creating an account mean the customer has activated?
Not necessarily. Account creation can be an intermediate event, but activation is better defined through a first action showing the beginning of product-appropriate value. Its relationship with later use or outcomes should be verified rather than choosing it simply because it is easy to track.
Should every funnel rate use the same denominator?
No. Each rate has a denominator answering a specific question, and it must be named. Activation can be calculated among registered accounts or visitors, but these give different results. Comparison requires comparable groups, a completed observation window, and clear counting units.
How should retention be applied in healthcare?
Measure continuity of care or appropriate follow-up for those who need it under a clinician's recommendation, not more visits for everyone. Respect privacy and consent, and do not treat a lack of need for follow-up as a marketing loss or a lack of public sharing as failure.
Sources and attribution
Approved educational source: “Digital Customer Experience: Arabic Explanatory Notes,” London School of Business Administration, presented by Jenna Tiffany, physical page 24 for the model and page 25 for comparison with the healthcare journey. This is private course material, not a public link for redistributing the file.
Original link displayed in the model slide: Customer Journey Map by Gust de Backer. It is included to trace the source's reference; we do not assume every later page update matches the course version.
Link displayed in the healthcare journey example: Digital Customer Journey by Nextiva. The material's healthcare example explains a different journey from AAARRR; this lesson's calculations and exercises are original hypothetical teaching examples.
Comments
No published comments yet.