An AI-search budget can increase before a team knows how to measure its contribution. That is a management problem worth solving, but it is not proof that the investment has failed. Equally, a rise in brand mentions is not proof that the investment has paid off. The useful question is what evidence a decision-maker needs before continuing, changing or expanding a specific activity. This article develops an original measurement framework around a newly released commercial research report.
What is new, and what was actually reviewed
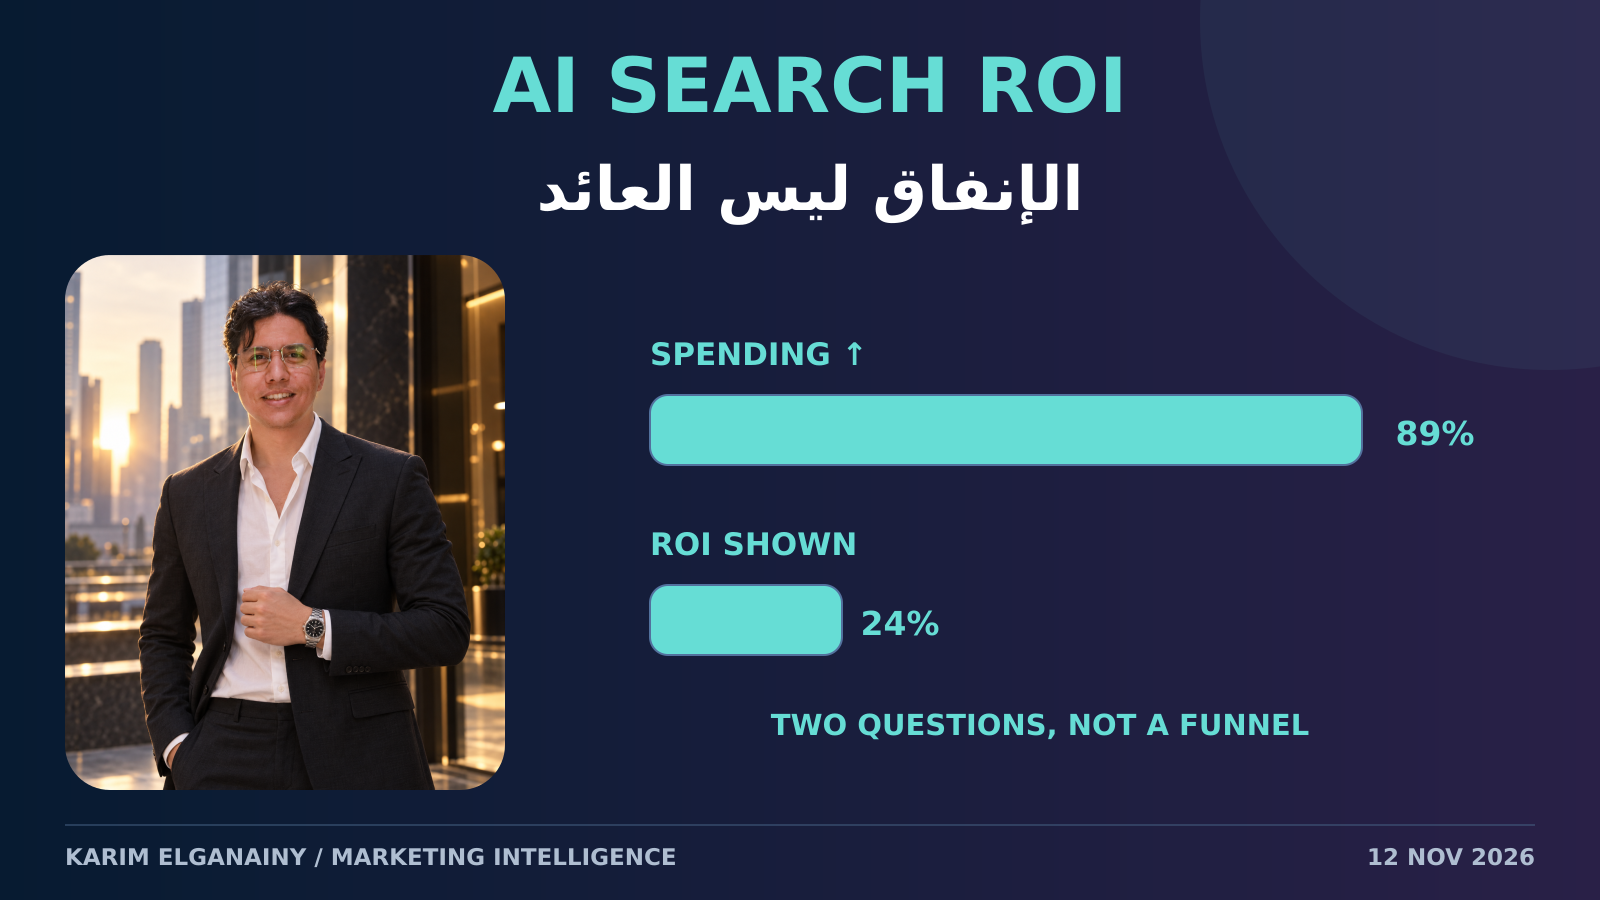
Peec AI launched Primary Sources on November 11, 2026. Its launch article reports that 89% increased AI-search spending over the past year, while 24% say they can demonstrate ROI. These answer different questions, not successive stages in a conversion funnel.
The public methodology describes a Sapio survey commissioned by Peec: 700 responsible decision-makers, US 300, UK 200, Germany 200, at companies with 100–999 or 1,000+ employees. Separate platform analysis covers July–September 2026, indexed against Q2. The full report requires an email; it was not accessed.
Read the two percentages without inventing a relationship
The spending percentage describes a reported change in resources. The ROI percentage describes a reported ability to demonstrate a return. They are not interchangeable outcomes. Dividing one by the other would not produce a reliable success rate, and subtracting them would not reveal how many respondents wasted their money. To answer those questions, a reader would need appropriate respondent-level cross-tabulations, definitions and supporting evidence, not merely two headline figures on a public page.
Nor does an inability to demonstrate a return establish that the return is zero. Measurement may be incomplete, the observation window may be unsuitable, or the activity may genuinely be ineffective. Those are competing explanations that require investigation. Conversely, saying that a return can be shown does not tell an outside reader how it was calculated or whether the calculation measures incremental value. A disciplined interpretation keeps uncertainty open in both directions rather than treating every unknown as either failure or hidden success.
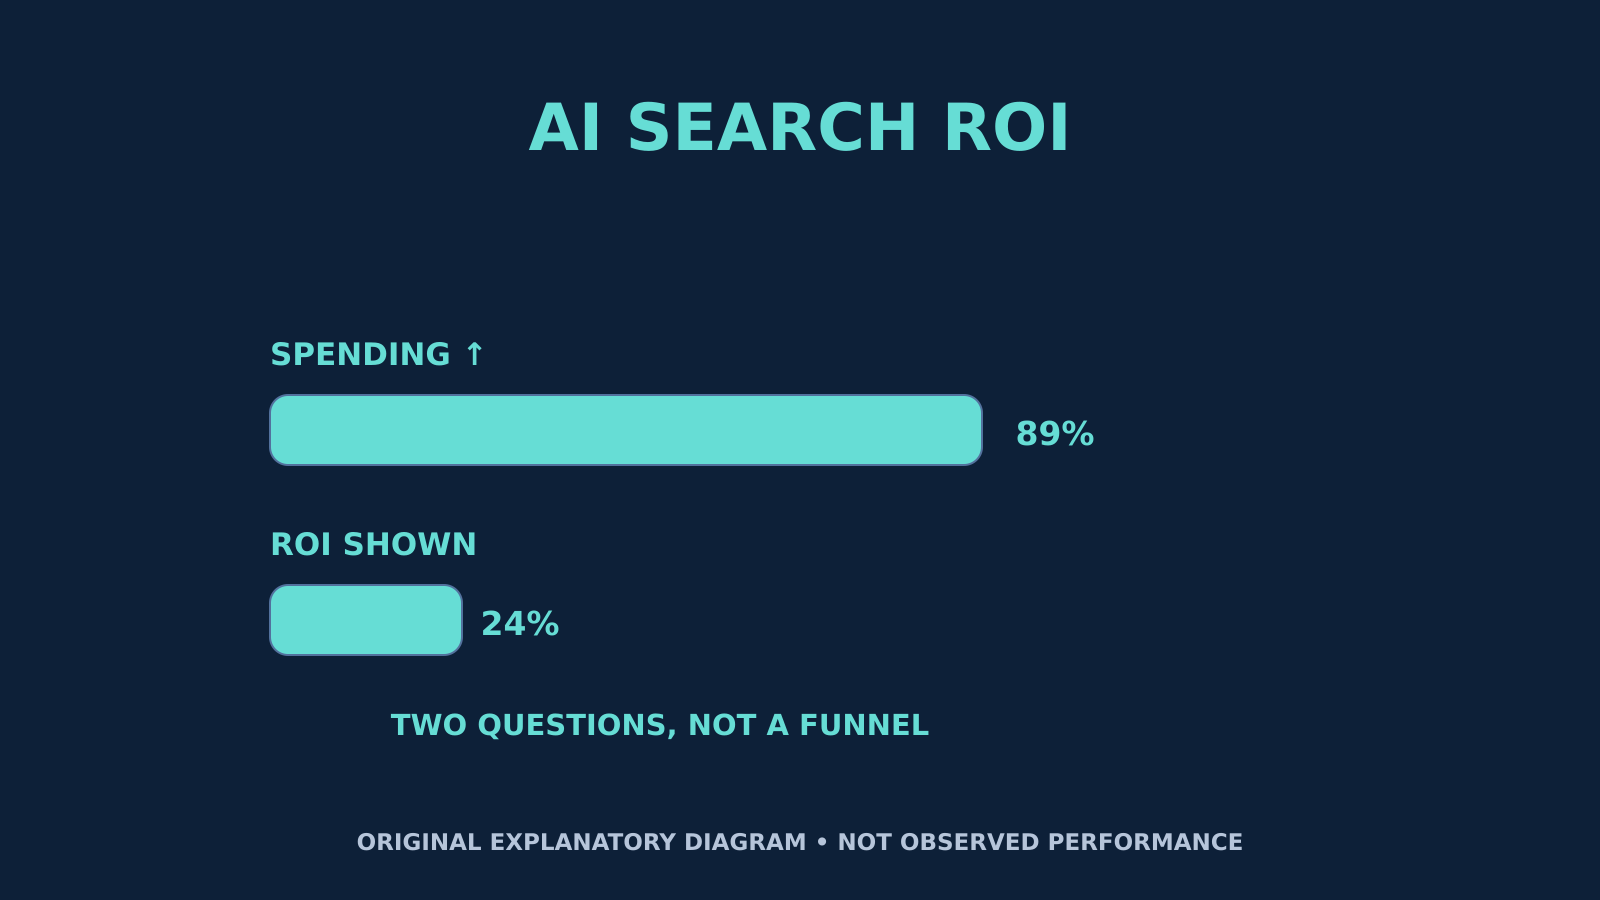
Original chart on a shared 0–100 scale: SPENDING↑ means spending increased (89%); ROI SHOWN means ROI demonstrable (24%). TWO QUESTIONS NOT A FUNNEL: distinct questions in commercially sponsored, self-reported research, not a causal estimate or a calculation of investment failure.
Identify the population before borrowing the conclusion
This is commissioned commercial research based on self-report, not a universal census of businesses or a randomized test of a marketing intervention. Its participating markets and company-size boundaries matter. A local owner-operated business, a public institution and an enterprise marketing department may have very different budgets, reporting systems and decisions. Treat the findings as a reason to ask better questions about your organization, not as a ready-made benchmark that every team should match.
The public material does not provide everything needed here to audit response quality, weighting, nonresponse or every question's wording. Do not invent those details or attach a conventional margin of error without knowing the sampling design. Also keep the survey separate from the platform observations. A period describing platform behavior is not automatically the survey's fieldwork period. New publication does not mean every observation was collected yesterday, and an indexed series is not an absolute count of all users or searches.
Write a decision contract before building a dashboard
Specify the decision the measurement will support. For example, a team might be deciding whether to maintain a small content-correction programme, expand it to another language or pause a poorly defined experiment. Write the possible actions in advance, identify who can choose among them and state what evidence would be sufficient. This prevents a dashboard from becoming an attractive collection of numbers with no agreed consequence for the next budget discussion.
Give the experiment a bounded scope. Name the product or service, audience, question set, language, intervention and observation window. Record what will remain unchanged where possible. A proposal to improve everything about AI discovery cannot be evaluated with the same clarity as a proposal to correct a particular information gap for a defined audience. A narrow pilot is not a lack of ambition; it is a way to learn whether the organization can make and explain a useful decision.
Build a ladder of evidence, not one blended score
Begin with availability: can the intended public material be reached and read? Next examine accuracy: do sampled answers represent the facts correctly? Then examine discovery: is the relevant material mentioned or cited within a documented question set? These observations describe different parts of the information environment. Combining them into one unexplained score can hide a critical factual error behind an improvement in mention frequency.
Continue with identifiable referral activity, qualified actions and commercial outcomes, while stating where the connections cannot be observed. A source citation may influence someone who never clicks. A direct visit may follow an earlier AI interaction that analytics cannot reconstruct. Conversely, a tagged referral does not prove that the visit would not have happened otherwise. Preserve these limitations in the report instead of filling the gaps with a fictional complete customer journey.
Define return using an agreed economic basis
For an internal investment decision, agree which value measure matters before calculating a ratio. Revenue alone may overstate the contribution when fulfilling the sale carries substantial costs. A contribution-based measure can be more appropriate, provided finance agrees on the included costs and the definition is applied consistently. Record the cost of software, staff time, editorial review, implementation and maintenance relevant to the intervention. Avoid making the programme look inexpensive by counting only the subscription invoice.
A proposed calculation is incremental contribution attributable to the intervention, minus programme cost, divided by programme cost. This is a planning definition, not a result from the report. The difficult part is establishing the incremental contribution, not writing the formula. If the data only support attributed revenue, label that measure accordingly and do not rename it incremental ROI. State the currency, time period and cost treatment so another person can reproduce the calculation.
A hypothetical example with a deliberately limited conclusion
Imagine a business-to-business service team that improves public explanations of eligibility, delivery and pricing conditions. This is an invented example, not a case study or reported campaign result. The team selects comparable service pages, schedules changes in stages and documents paid-media activity and other major events. Its aim is to learn whether the corrections improve understanding and the quality of enquiries, not merely whether more pages receive citations.
Suppose enquiries rise after the first changes. The team should not immediately credit all additional demand to AI search. It checks the timing, source information, enquiry quality and comparison pages, and asks whether a simultaneous campaign or seasonal change offers another explanation. If the evidence remains weak, the conclusion can be that the changes are operationally useful but commercial incrementality is unresolved. That is more actionable than presenting an impressive percentage whose causal meaning cannot be defended.
Track costs and quality alongside volume
Record the work required to produce and maintain the intervention. Count research, review, localization and correction time, not only the minutes spent generating a draft. A programme may appear to scale efficiently while quietly creating a large maintenance burden. Assign an owner and review date to facts that can expire. Measure correction effort as well as publication output so that an apparent productivity gain does not conceal future cleanup costs.
Quality checks should cover factual accuracy, service boundaries and the consistency of translated versions. Where the work concerns healthcare, public service information can often support a pilot without patient records. Do not infer treatment quality from marketing engagement or present a growth experiment as clinical evidence. A useful operating scorecard includes harmful or confusing outcomes, such as irrelevant enquiries, alongside desirable actions. Growth that creates misleading expectations is not an unqualified success.
Handle changes in the measurement environment
Keep a dated log of changes to the website, tracking configuration, question set and observed platform behavior. If the collection method changes, mark the break in the series. Avoid presenting two differently collected periods as a clean trend. Preserve a stable core of questions for comparison, while using a separate exploratory set to investigate new topics. This gives the team continuity without pretending that the information environment never changes.
Recheck unexpected movements before making a budget decision. A sudden increase can come from a classification change, duplicated events or a smaller denominator rather than a genuine improvement. Inspect a sample of underlying observations and reconcile totals with the relevant operational system. When a difference cannot be explained, label it unresolved. Do not quietly discard an inconvenient interval or select a new baseline simply because it makes the chart more persuasive.
Use organizational associations as hypotheses
When a report links a management practice with a better reported outcome, consider alternative explanations before copying the practice. Teams with more resources may adopt both the practice and stronger measurement. Successful organizations may invest after seeing results, rather than achieve results because they invested. Different definitions of success may also affect answers. An association can identify a useful question, but it cannot by itself establish what would happen if your team made the same change.
Test the proposed mechanism locally. If clearer ownership is the hypothesis, define a responsibility change and examine whether decisions become faster and evidence more complete. If a new tool is the hypothesis, compare its incremental usefulness with the existing process, including the effort needed to validate its output. Do not treat purchasing a platform or creating a job title as a substitute for demonstrating that the underlying work improved.
A practical review for the next budget meeting
Prepare a short evidence pack with scope, baseline, intervention, costs, observed outcomes, uncertainty and a recommended next action. Separate what is directly observed from what is inferred. Include a stopping rule and a date for reassessment, so that a pilot does not continue indefinitely merely because nobody agreed how to close it. Invite finance and operational owners to challenge the definitions before the final investment decision.
The appropriate outcome may be a controlled expansion, a narrower test, improved measurement or a pause. None requires pretending that a commercial survey supplies a universal spending target or a guaranteed ranking strategy. The central lesson is to make the evidence strong enough for the decision at hand, while being explicit about what remains unknown. Better measurement is valuable when it changes a choice, not simply when it adds another chart to the report.
Sources and editorial boundary
The two public sources linked above support the brief research description and headline figures. No email was submitted and no gated report was read. All workflows, calculations and examples are original analytical proposals, not additional findings from the study or promises of a commercial return.
Comments
No published comments yet.