
Read the denominator before the headline
Luminate’s TikTok-commissioned report and TikTok’s November 18 summary report prior TikTok virality for 94% of 484 Billboard Global 200 tracks studied (March 11–December 4, 2025; holiday tracks excluded). In a separate 454-track longevity comparison, the averages were eight versus two weeks. Neither statistic establishes causation.
A useful reading starts with the observed group, not the impressive number. If you begin with chart entrants and ask which had a prior TikTok moment, the statistic describes those entrants. A label examining tracks that circulate on TikTok starts with a different population. Its question is how many of those tracks later meet a defined outcome. Tracks that do not enter the chart would need to be included in that population. Without that information, the percentage cannot be repurposed as a forecast for tomorrow’s release.
Duration is also separate from entry. A comparison of time on the chart involves songs for which a chart stay can be observed. It does not say that a viral track is four times as likely to get onto the chart, or that adding creator spend will keep a specific song there longer. Audience enthusiasm may produce both shares and streams; release plans and other distribution can influence both. A marketer can take the result as a reason to inspect the path, without treating the path as proof.
Put the two questions side by side
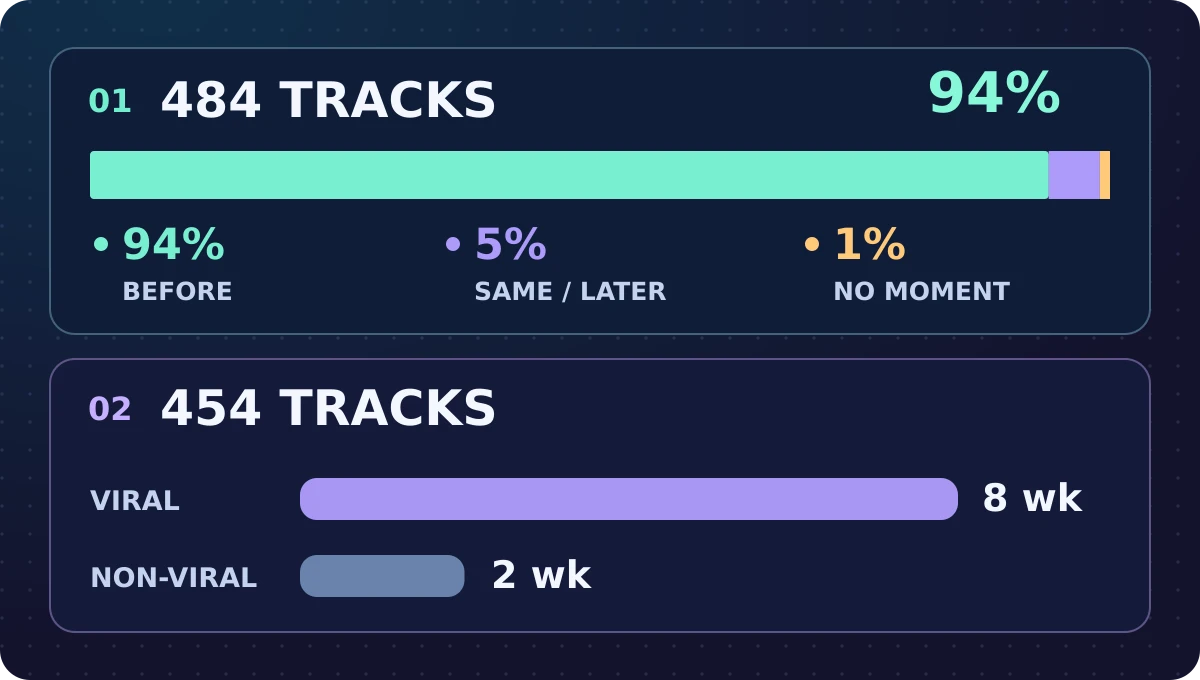
Original illustration created for Karim Elganainy’s website from Luminate’s TikTok-commissioned report, pp. 22–23 and 37. The panels use different chart samples; neither shows a causal effect.
The upper panel looks back from the 484 chart entrants and classifies whether their TikTok moment came before, around or after chart entry, or was not observed. The lower panel compares average chart duration for viral and non-viral tracks in a separate 454-track sample that also removed late-2024 repeats. Neither panel starts with all eligible TikTok-posted tracks and follows them forward to chart entry, including those that never chart. That would be a different evaluation; mark unobservable outcomes as unknown, not as confirmed failures.
A campaign manager needs a similarly precise distinction in a weekly presentation. If an artist asks whether a sound's broad circulation is actionable, answer in terms of the decision available now: whether the credited track is easy to identify, whether interested listeners have a clear next step, and whether the label can observe repeat listening. None of these checks needs a global chart prediction. They can reveal a correctable handoff even if the broader causal question is unresolved.
Finally, be clear what adding a local data point would and would not establish. A local release report may find that more visitors reached its listening page after a creator post appeared. That says where a measurable change happened, provided the reporting rule stayed stable. Timing by itself cannot rule out coverage, fan activity or promotion that arrived alongside the post. Use the distinction to decide what test you can actually run, not to dismiss every observation as useless.
Measure four different events
Start with short-video engagement. Use the platform’s available counting rules and record what the metric covers. A clip can be watched because the story is interesting, the creator is popular or the soundtrack fits the moment. None proves that a person knows which artist performed it. Check that each placement uses the intended edited or full version and clear attribution. Do not add views, comments and unique people together in a single score. Their units are different and their relevance to discovery will vary.
Next, separate a save or add-to-library action from the act of listening. A save can indicate a useful next step, but a person may save a track to revisit later and never play it. Off-platform streams are measured under the listening service’s own counting rules and may not be linked to the people who saw a short video. Keep those streams as their own aggregate series. Document any gap between the platform reporting window and the listening data rather than matching records solely because their dates look close.
Commercial outcomes should have a separate definition. A paid outcome may mean a verified ticket purchase, eligible merchandise order or other auditable result chosen by the label. Do not call a save or stream a paid sale. Track cancellations, fees and costs under the same convention when judging financial value. A campaign might be useful for helping existing fans find the official version while not covering its spending. That is a defensible conclusion if the purpose and measures were fixed before review.
Use a fictional release to spot a broken handoff
Imagine a small independent label testing discoverability for a fictional track, Harbor Signal. The team notices that audience questions are less about where to buy than about which version they heard. Rather than commission more clips immediately, it audits the variants: the caption, on-screen credit, approved audio edit and destination. One visual might showcase a performance while the link points to a different recording with similar packaging. Correcting that mismatch is a practical first step even without evidence of sales impact.
Set one short-video brief with a clear on-screen title and a destination that lists the correct recording. Compare it with the usual presentation while holding the underlying offer steady. If the label can fairly assign variations, define the unit and assignment method before launching. If it cannot, call the comparison descriptive; compare like conditions where feasible and record deviations. Do not reuse a single track’s report as if it were a result across the whole roster or in every market.
Agree beforehand what observation ends the test. If there is no rights clearance for one edit or the destination stops working, pause the affected version rather than waiting for more reach. If viewers can find the correct version but the label cannot access matching stream data, report improvement only on the task it could verify. If a planned paid outcome is unavailable, do not swap in a more attractive number midway. The example is invented to explain the procedure, not a claim that any artist or label saw those results.
Build a baseline the team can defend
Write down the period and releases in scope, then choose a comparison that asks the same question under reasonably similar conditions. The first week of a new release and a quiet week for an older recording do not have equivalent starting points. Pre-release promotion, existing fan interest and catalog depth can make raw comparisons look precise while measuring several changes at once. Include the conditions you could not hold constant and mark which limitations prevent anything stronger than a directional read.
A holdout can help where the team can assign exposure credibly and observe the chosen outcome without mixing groups. A common complication is sharing between groups: fans can see a clip even if the label did not direct that creative to them. If separation is weak, the result may still reveal whether the rollout was feasible, but it cannot be sold as a clean estimate of influence. Do not draw identical causal conclusions from a well-controlled test and a simple before-and-after chart.
Set a window that fits the decision. A reply about the song’s title can arrive before a track save, while listening or paid purchases might arrive with delay. If the window closes before all feeds mature, record what is provisional and revisit with the same definitions. Do not keep extending the window to rescue a weak result. A reviewer should know what was expected to happen in time and what the label will do when an outcome remains unknown.
Protect permissions and decision quality
Use only material cleared for the placement. Specify which audio, visuals and text go with each version and who can approve a change. Permission to use one clip or format should not be assumed to extend to every territory or reuse. Make it possible to remove an incorrect credit promptly and document the correction. A placement that cannot be supported properly should not continue solely because it attracts attention.
Give reviewers only the data they need. A campaign record can often work with an edit identifier, destination, date and aggregate outcomes; it does not require copying listener identities or private messages into a campaign spreadsheet. When one platform does not let the label reconcile records at the person level, describe that limit instead of inventing a cross-platform match. Support inquiries can be summarized by issue without turning someone's words into advertising material.
Keep an operational checklist next to the metric table: correct title, correct version, usable destination, approved materials and a named owner for a correction. This checklist can prevent obvious waste before anyone debates the meaning of engagement. Separate a genuine shortage of evidence from a missing responsibility. If nobody owns the destination or the outcome definition, assigning that task may be more valuable than changing the creative.
Decide which improvement to test next
At review, compare the results by what they can support. Strong engagement with weak identification suggests fixing the credit or link. A useful save signal without listening data suggests verifying the next step rather than reporting streams you cannot see. A rise in streams without credible comparison suggests checking concurrent activity, not writing an attributed sales claim. Each decision stays close to the evidence.
If the team is considering more creator spending, compare its incremental cost with the specific outcome it intends to improve. Explain what evidence would justify expansion, what calls for an operational repair, and what should stop the campaign. Small teams can document one useful change even when data are too sparse to justify a large rollout. Do not derive a budget from a global chart statistic that is silent about local demand and campaign economics.
Record the next decision
Write the next action in a form that someone can verify: what they will change, who owns the change, what they will observe, and how they will handle missing outcomes. An experiment may be worth keeping because it fixes a confusing path, not because it puts a release onto a chart. A useful chart statistic should sharpen the question, not answer a different one under a bigger headline.
Comments
No published comments yet.