
1. Which decision is the work organised around?
Imagine an independent outpatient clinic whose team is proud of keeping its appointment calendar full. Its website also records many submitted requests. Yet some callers have to repeat details already provided, and some requests never result in an attended first visit. Those observations can coexist: a calendar measures use of appointment capacity, while a form measures whether somebody submitted information. Neither necessarily tells you whether a person completed an appropriate first appointment they understood and could attend. The gap between these measures is a good place to begin assessing culture.
A product-focused question might be, “How do we design and deliver an excellent appointment service?” A customer-focused question is, “What does a person need to complete an appropriate first visit, and where does our way of working make that difficult?” Both can guide useful decisions. The second widens the unit of work beyond the service itself to include information, choice of access channel and handoffs between teams. It does not mean accepting inappropriate requests, promising treatment or ignoring clinical judgement. Quality, choice and privacy remain conditions of the pilot, not outcomes to trade away for better conversion.
2. Read the five dimensions together
The MarketCulture comparison is most useful as a set of paired questions. An organisation may start on the product side when assigning responsibility for quality and on the customer side when improving a journey across several services. Look at what the organisation repeatedly does when objectives compete, not how it describes itself. Read the axes together: a new strategy statement is unlikely to change the experience if no team owns the process or if everyone is rewarded for stopping at a different point.
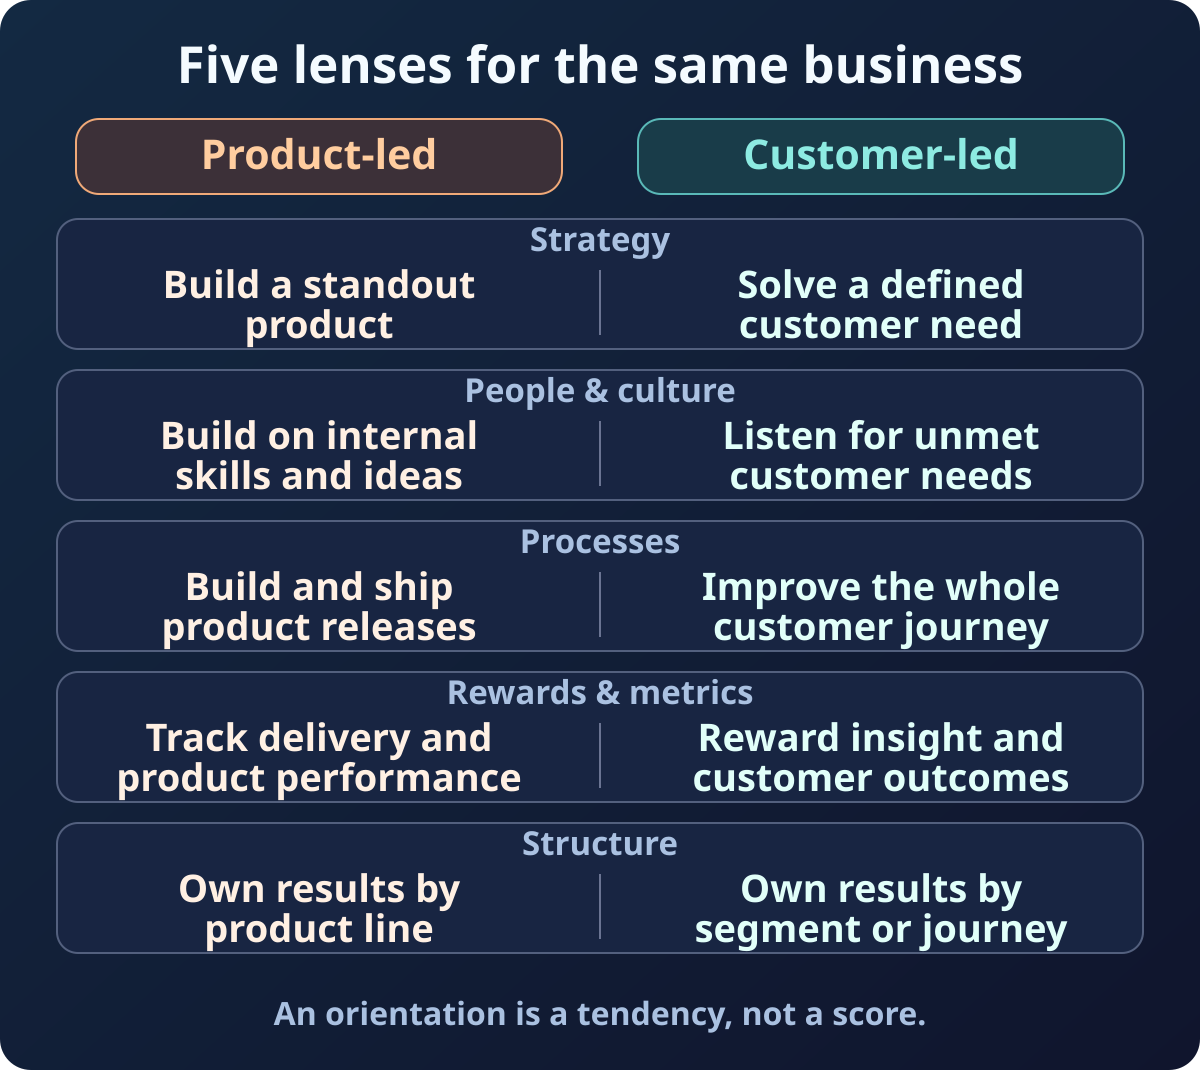
Original explanatory matrix created for Karim Elganainy’s website. It adapts the five dimensions on course PDF p. 21 and the MarketCulture comparison; it is not a score or a required organization chart.
Strategy: an excellent service or an effective pathway?
A product-oriented strategy starts with the service or package and asks what would make it better. That can give teams a defined unit for investment and quality review. Taken alone, it may send attention toward features when the real barrier is not the service itself. A customer-oriented strategy starts with the outcome a person needs and asks what combination of information, channels and services makes it possible. It becomes unfocused if every expression of interest is treated as a reason to launch a new service.
In the clinic example, hold the existing clinical offer fixed initially. Trace the route to an appropriate first appointment and ask whether an obstacle concerns incomplete information, unsuitable times or difficulty accessing the preferred channel. This helps the team distinguish something that genuinely needs a different service from something it can repair through a clearer path. Keep clinical eligibility and professional standards the same. The strategy question is which obstacle to address and how to observe the result, not how to fill every slot regardless of fit.
People and culture: developing expertise or learning needs?
Product expertise is essential when teams need to create and maintain reliable services. It can produce useful ideas, but a culture that values novelty alone may overlook repeated obstacles outside the product team’s view. A customer-oriented culture listens to what people are trying to accomplish and tests the team’s explanation against evidence. It still needs specialist judgement. A loud anecdote or a request outside the clinic’s role is not a mandate.
In a fictional workshop, clinicians, scheduling, marketing and reception review 10 de-identified request journeys from several contact channels. They distinguish what was actually observed from what each team thinks explains it. If several people ask about the same step, the pattern becomes a question to investigate, not a representative estimate from 10 records. A review should also identify contradictory cases. Someone who found the instructions clear through a phone call may have experienced a different version of the pathway from someone using the website.
Processes: developing services or managing the whole journey?
A product-oriented process governs how a service is designed, reviewed and improved. That discipline helps maintain consistency. It can miss exceptions at the boundary between teams because each unit completes its immediate task and hands the case over. A journey-oriented process defines what a successful handoff means from the customer’s point of view, with a responsible receiver and a fallback. It becomes hard to maintain if it treats every case as an exception.
Map the steps from web request to scheduling, confirmation and arrival. Test one handoff rather than altering the whole route. For example, check whether the stated time preference reaches the scheduler and whether the person understands the next action. Never ask people to send health details in a generic marketing form. Offer the phone path rather than making the digital channel the only option. A handoff works when the next team can act on the appropriate information and the person does not have to start over.
Rewards and metrics: fast launches or shared completion quality?
Launch speed, service sales and utilisation can reveal capacity and execution. They are not substitutes for completion quality. A team can be rewarded for collecting requests while a different team struggles to route them appropriately. Shared measures can focus both on whether the underlying visit was completed, but broad targets can also hide differences in who can use the path or encourage unsuitable requests to be pushed through.
Specify the audience segment and define exactly what appears in the numerator and denominator. Distinguish a submitted request from an eligible episode, a confirmed appointment and a visit that actually took place. Preserve technical and clinical quality checks next to the new metric. A person who is correctly routed elsewhere or whose unsuitable request is appropriately declined should not automatically count as staff failure. Recognise accurate decisions and useful transfers, not just higher volumes. Keep reasons interpretable without circulating unnecessary details.
Structure: product ownership or customer-journey accountability?
A product profit-and-loss account makes economics and responsibility visible for a defined service. The course contrasts it with accountability organised around customer segments. That contrast does not require a clinic to restructure its accounts or decide access by profitability. A segment-based view can reveal a problem that crosses several product or service lines, but it needs boundaries and clear decision rights to avoid adding another layer of confusion.
Use a hybrid operating arrangement for the clinic example. Name a single pathway owner and keep existing product and clinical owners. List those people together in a weekly review, with a specific task for each when the handoff fails. In a useful review, the pathway owner describes what the person encountered and the service owner checks whether any proposed correction would alter the conditions under which the appointment is offered. This allows the group to address friction without making clinical or financial decisions from a marketing report alone. Decide who can pause the change, who can correct instructions and who reviews clinical or privacy concerns. This is an operating design, not a rewrite of reporting lines. Keep management of service economics separate from who can access an appropriate appointment.
3. Audit the evidence, not the intentions
For each dimension, give an evidence-based rating using an original teaching rubric. Use 0 if the practice is not documented or observable, 1 if it appears inconsistently or in a pilot, and 2 if it is repeatable and supported by an owner and evidence. For every rating, record one observation and one counterexample. If no evidence can be found, use 0 and state what is missing rather than inventing an example. The rating reflects the evidence available to the team; it is not a validated measure of all customer-oriented behaviour.
In the fictional clinic the ratings are strategy 1, people and culture 1, processes 0, rewards and metrics 0, and structure 1. That totals 3/10. The number is a teaching summary, not a weighted index or a benchmark for comparisons between clinics. An appointment team could be very strong technically while having little evidence of a coordinated web-to-scheduling routine. Another organisation might document its processes well but still have examples of inaccessible communication. Scores help select questions; they do not settle them.
Focus here on the process and reward axes. For the process evidence, find a de-identified request trail and ask whether the preference travelled as intended. For the reward evidence, inspect the report to see whether it stops at submission. Give each follow-up a named owner, an evidence artefact and review date. Rank possible changes by harm, feasibility and what the team can actually learn, not by the total score alone. Something urgent can warrant action even on an axis that was not the lowest. During review, ask whether the artefact would be convincing to a colleague outside the department. An internal report with a good-looking total is not necessarily evidence that a handoff occurred. Looking once at the entry and once at the receiving end helps establish whether the documented practice is actually repeatable.
4. Run a bounded pilot and review the measures
Use a hypothetical 4-week plan. In week 1 define the baseline and review the path; in week 2 change the handoff; in week 3 observe the new operation; in week 4 review whether to proceed, iterate or stop. The change is limited to preserving a stated time preference from the web request for scheduling and supplying a clear next step with a phone option. Do not quietly change who is considered eligible or remove a working fallback. Assign a person to restore the original handoff if the change cannot be supported safely.
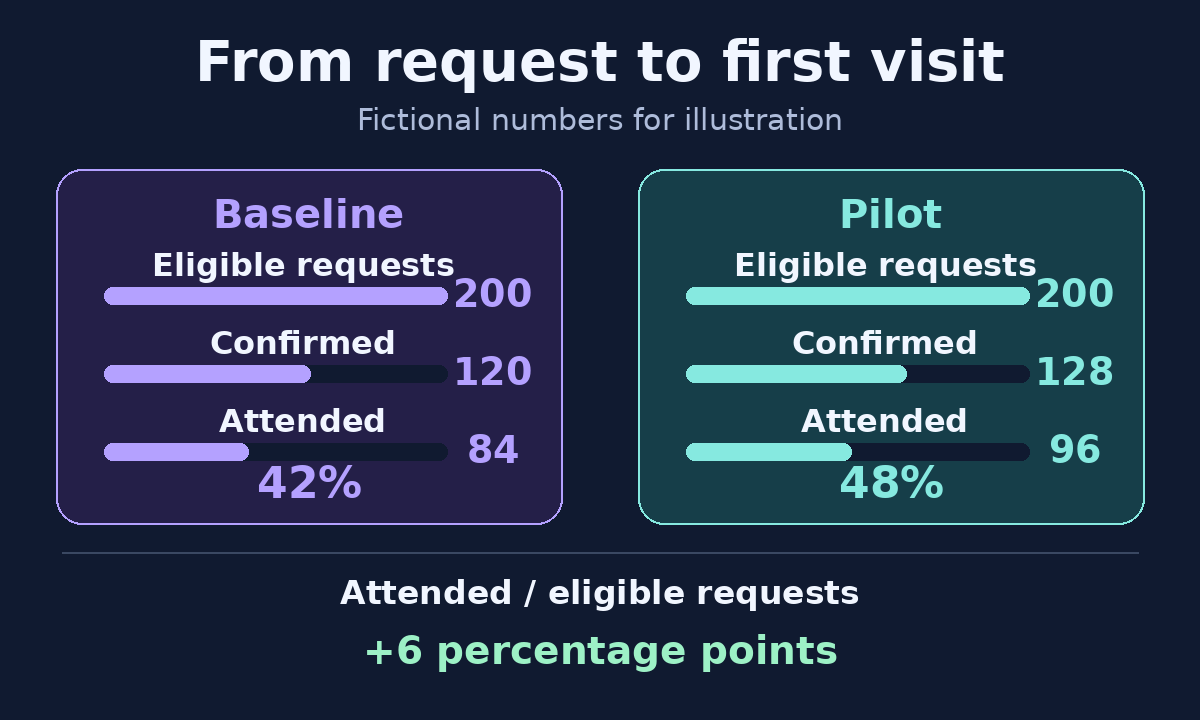
Original teaching figure: each fictional cohort started with 200 eligible requests; 120 confirmed and 84 attended at baseline, versus 128 and 96 in the pilot. That is 42% versus 48% of eligible requests, a descriptive six-point gap, not proof of causation.
Use comparable baseline and test cohorts with the same eligibility and 14-day maturation. If the last episodes have not reached that point by the pilot review, wait before comparing complete outcomes. Count one entry per request episode and decide how repeated submissions are reconciled. Define an eligible request, confirmed first appointment and attended first appointment in operational terms. Only count attendance under the same confirmed cohort in this nested example. Record missing events as unresolved until the team can establish what occurred, rather than letting incomplete records silently disappear from the sample.
Each fictional cohort has 200 eligible requests. Confirmed first appointments rise from 120 to 128, equivalent to 60% and 64% of eligible requests. Attended first appointments are 84 and 96, respectively: 42% versus 48% of requests, a difference of +6 percentage points. Among confirmed appointments, the corresponding attendance rates are 70% versus 75%, or +5 percentage points. The median time to confirmation is 18 hours versus 12 hours among confirmations. These are descriptive calculations within the example, not experimental findings or claims about a real clinic.
The two attendance denominators serve different decisions. Starting with all eligible requests keeps the full pathway visible, including people who never reached confirmation. Starting only with confirmations helps the team examine what happened after that step, but it can conceal changes in who got confirmed. The faster median can likewise reflect which requests reached confirmation, not necessarily faster handling for everyone. Report the counts, denominators and window together so the audience can distinguish these questions.
A comparable-looking result can still be affected by channel mix, appointment capacity, holidays, weather or differences in the people entering the pathway. Changes in attribution, missing attendance records and failed deduplication can change the figures too. Check whether the same events were captured and the groups had similar opportunities. Do not claim a causal lift or statistical certainty from the fictional comparison. Review complaints, incorrect routing and privacy incidents separately rather than inventing a favourable figure. Stop for a privacy or safety issue and examine equitable access and phone queues before expanding. The aim is appropriate completion, not the highest possible raw conversion. Inspect the fallback separately as well: if the online version appears easier because more requests move to an already stretched phone queue, the teams need to understand who waits and why. Keep a distinction between an improvement in experience and an accounting change that merely moves effort from one queue to another.
5. Apply the idea to a different job: inventory software
Imagine a small-team B2B inventory software provider that currently celebrates dashboard releases and feature adoption. Those can be worthwhile product measures, especially if a new import tool is easier to maintain. But a customer’s immediate task might be to complete the first inventory reconciliation within 7 days of account activation. Write that outcome alongside the existing measures; it is not a promise of sales or a replacement for product specifications. Explain what counts as completion so opening the dashboard is not confused with getting a reconciliation done.
Keep the reliable import feature and connect the onboarding, support and product owners. Let users choose assisted import or self-service, and identify where each route fails, for example when field names cannot be aligned. Report participation by route and recognise that the people opting for help may face a different problem from those working alone. A higher completion share in either group is not enough to attribute the outcome to the route. Do not transplant the clinic’s booking design: the unit here is an activated account, the task is reconciliation and the operational dependencies are different. For example, a small team might already have a clean export while another account needs to resolve column mismatches before it can begin. A useful review asks which exception prevented reconciliation and which owner can resolve it, while keeping documentation accurate for both routes. Check that the assisted option does not obscure the self-service path for people who prefer to work independently.
6. Exercises and model answers
Exercise 1. Apply the 0–2 grid to a real or fictional organisation without including personal data. Pick two weak axes and write an observable fact and a counterexample for each. For each improvement name one owner, one artefact and a deadline. Compare how you used evidence with the fictional clinic’s 3/10, not whether your organisation scored higher. A model answer might identify that preferences sometimes reach scheduling but no shared check exists, and that the current report rewards submitted requests rather than tracking completed visits. Assign the process check to the pathway owner and the revised report to its existing owner.
Exercise 2. Choose and justify the denominators for the clinic’s attendance numbers. The full-pathway answer is 42% to 48% of eligible requests, or +6 percentage points. The post-confirmation answer is 70% to 75% of confirmed appointments, or +5 percentage points. Neither proves causation. List one plausible change in access or capacity and explain how you would check it. Include an explicit stop for a privacy or safety issue. The worksheet should record the decision, numerator, denominator, maturity window, owner, guardrail and next review.
For a 30-minute kickoff, use the worksheet to agree on a single journey, the person responsible for its next decision and a piece of evidence everyone can inspect. Check the counterexample instead of discussing the average alone. End with a clear task and a point at which the team will review whether it worked. If several improvements look plausible, choose the smallest one that can be introduced without obscuring other causes or creating avoidable access problems.
7. Keep the product-led strengths that protect the customer
Maintain reliability, accessibility, economics and professionalism. Product profit-and-loss accountability and robust quality checks can coexist with a cross-team owner for customer friction. Avoid changing the organisation chart on evidence from a single handoff. A narrow repair with a known fallback can reveal whether the problem lies in a step, a gap in staffing or in the entire way teams coordinate. Distinguish signals that recur under known conditions from anecdotes that deserve attention but do not yet describe the whole journey.
Before approving a test, name the audience, outcome, existing evidence, owner, guardrail and review date. If the proposed action does not help a customer achieve an appropriate task, fix the question before changing the metric. If it does help, ask which product strength makes the result possible and how to preserve it. The useful distinction is not which side wins, but which lens reveals the next defensible improvement. Record the conditions under which you would stop or revert the change, and make those conditions visible to the people answering requests. A test is not finished merely because a group produced a dashboard. It is finished when somebody can explain what was learned, what remains uncertain and who will decide what happens next.
8. Source notes
The comparison is taught in lecture 1 of the London School of Business Administration digital customer experience course presented by Jenna Tiffany, physical page 21 of the explanatory Arabic PDF, corresponding to slide 19/30. The course contrasts product-centric and customer-centric practices across five dimensions. This lesson paraphrases the concepts and does not reproduce the course slide. Both examples, the teaching score, the pilot design and the artwork are original applications, not findings from that page.
Chris L. Brown’s 2012 MarketCulture article describes the balance between product accountability and incorporating customers into decisions. As a separate scholarly parallel, Shah, Rust, Parasuraman, Staelin and Day’s 2006 article on customer centricity discusses barriers involving culture, structure, processes and financial metrics. Neither source validates the illustrative scoring grid, clinic figures or fictional software example in this lesson.
Comments
No published comments yet.