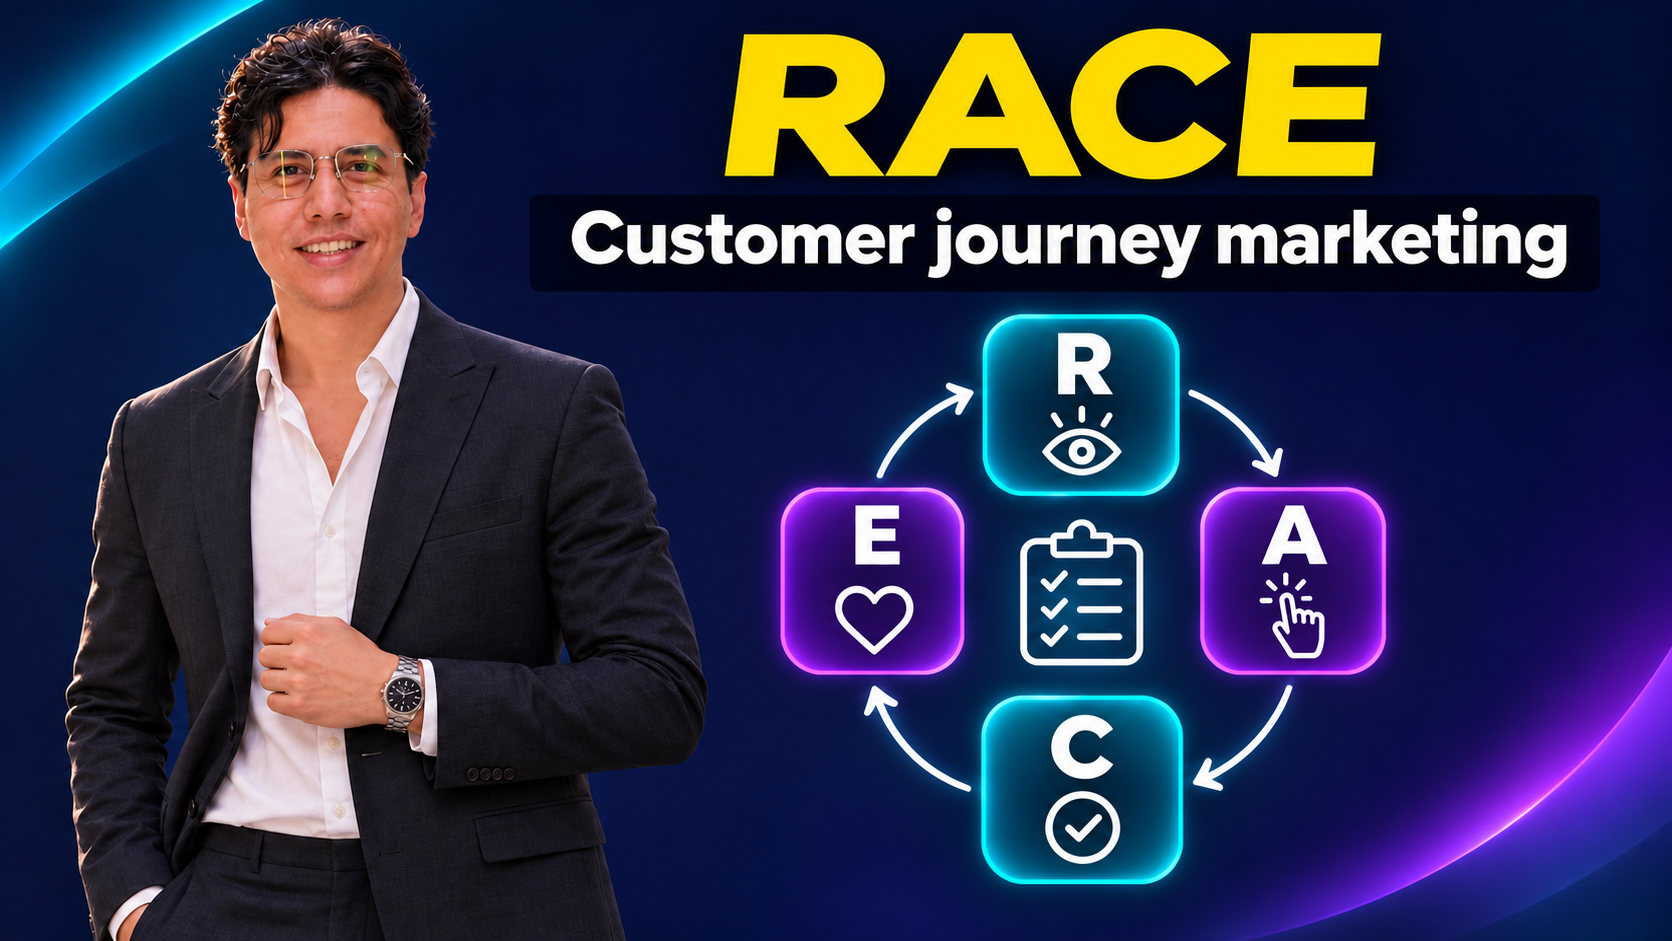
Why do we need a framework connecting the whole journey?
A campaign may generate thousands of visits, and the content team may report healthy engagement, while the number of actual customers remains below expectations. The familiar debate then begins: is the problem the advertisement, the website, or the sales team? A useful answer is difficult when every department presents a separate number as evidence of its success. Advertising measures clicks, the website measures sessions, sales measures contracts, and customer service measures response speed, but no shared map explains how these results connect.
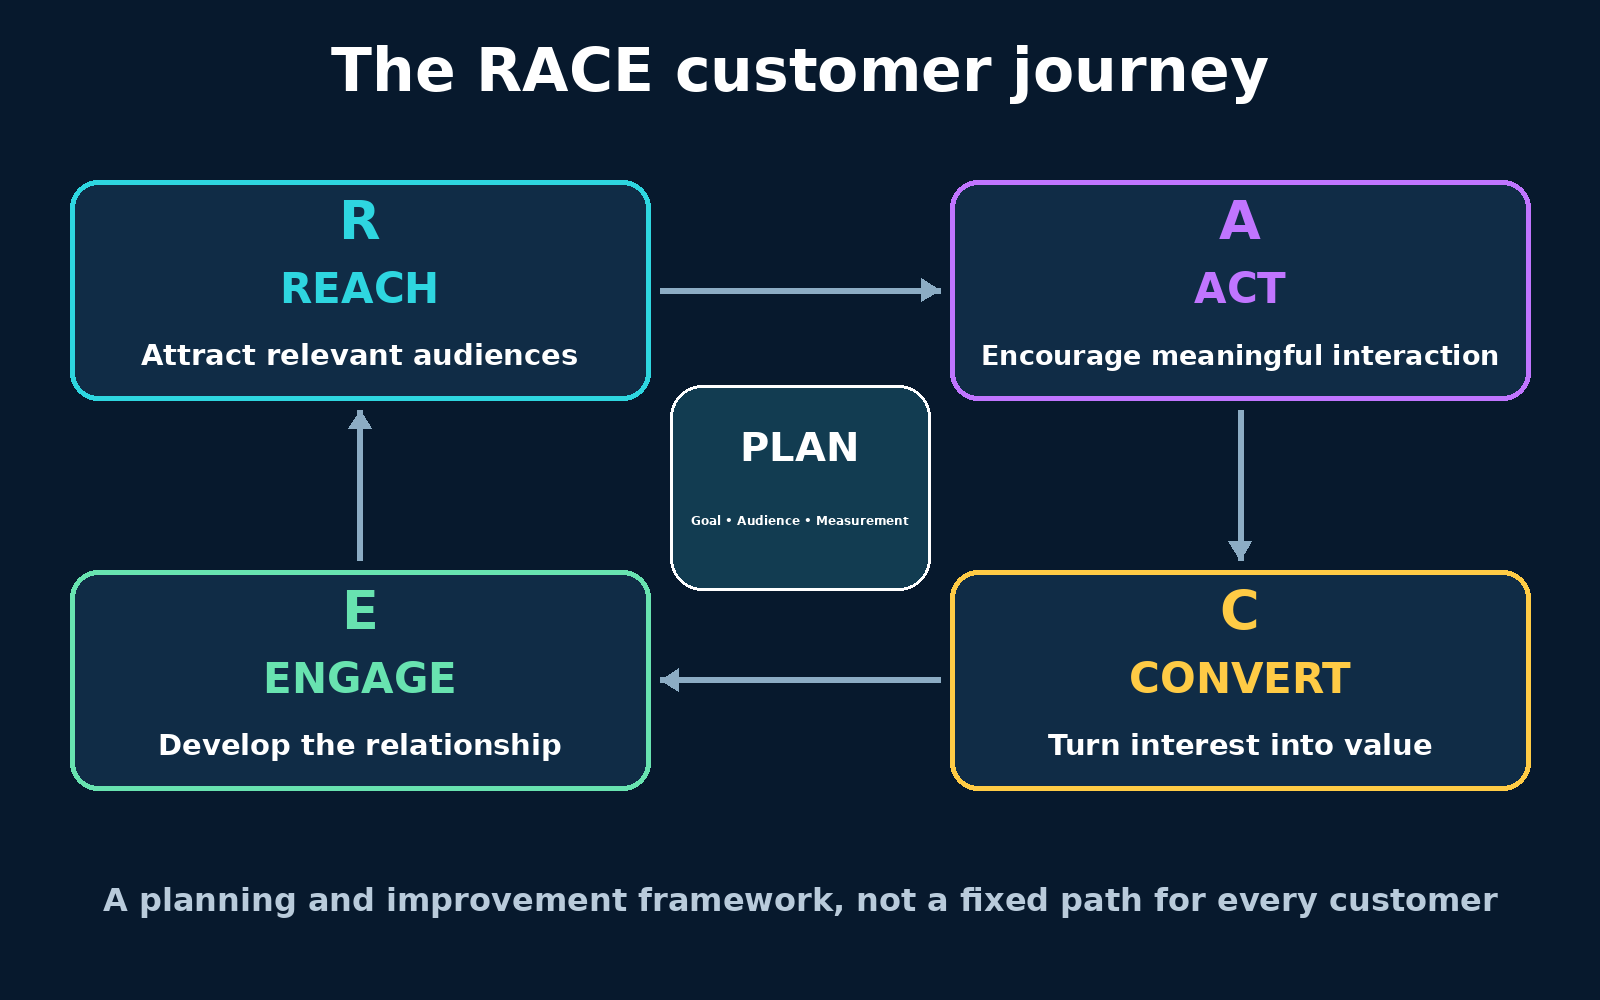
RACE helps build that map. It organizes work around reaching an audience, encouraging a useful initial action, turning interest into a commercial outcome, and developing the relationship after conversion. Its practical value is a more precise question: at which transition are we losing an opportunity, what evidence supports that diagnosis, and who owns the improvement? The framework does not guarantee growth or replace market understanding and product quality. It structures decisions and improvement experiments so that we do not buy additional visits before understanding what happens to the visits already arriving.
Definition, source, and boundaries
RACE stands for Reach, Act, Convert, and Engage. Here, these mean reaching people, prompting an initial action, achieving conversion, and developing the relationship. Dave Chaffey developed the framework at Smart Insights, and the approved course material presents its four stages within the digital customer journey. It also describes planning before execution and connects stages with channels and measures. This lesson develops an original practical explanation from that structure; the numbers and business cases below are hypothetical teaching examples, not results from real projects.
The stages sometimes appear as a funnel to make measurement easier, but an individual's journey is not a straight line. A visitor may return to comparison after seeing a price, an existing customer may buy without encountering a new advertisement, and a satisfied customer may recommend the brand to a friend. We therefore use the diagram to organize work, not to claim that everyone follows the same stages in the same order. Each transition needs a definition suited to the organization because buying a consumer product differs from signing an annual contract or attending a service appointment.
Before execution: what are we trying to change?
Begin with Plan: define the segment, the problem you want to solve for it, the promise you can deliver, and the desired outcome within a stated period. “We want more sales” is not sufficient for a decision. A more useful formulation is to increase delivered orders from a defined segment while maintaining a minimum contribution margin and avoiding an increase in complaints. We now have a commercial objective, quality guardrails, and a measurement period, and can connect activities to them.
Review operating capacity before setting the target. If inventory supports one hundred orders, or the team can handle fifty inquiries daily, attracting thousands of requests that cannot be served may damage the experience. Record the baseline clearly: qualified visits, meaningful actions, final conversions, and return behavior over an appropriate period. Separate missing data from poor performance; an empty field is not zero, and a failure to link sales to sources does not prove that marketing made no contribution.
Reach: find an appropriate audience
Reach asks whether we are reaching people who could benefit from the offer at the right time and in the right context. Tools may include search, content, public relations, partnerships, and advertising, but tool selection follows audience understanding. A store selling specialized spare parts may benefit more from a specific search query than from a widely shared video. An organization offering an unfamiliar service may need content explaining the problem before people begin searching for the solution by name.
Measure both the scale and quality of reach. Impressions describe displays, reach estimates people within a platform's limitations, and visits describe movement to a destination. Do not add the reach of two platforms and call the result unique people; the same person may appear in both. Qualified visits can be a practical measure if qualification is defined in advance, such as an appropriate country or intended service page. Then examine their contribution to later steps so that a channel is not rewarded simply for attracting a large but poorly matched audience.
Act: a small action revealing meaningful interest
Act is where exposure becomes an initial behavior that matters. It might be downloading a guide, using a calculator, opening product details, or requesting information. Interactions do not all have equal significance, and every click is not evidence of purchase intent. Define one main action reflecting progress in understanding or deciding, together with supporting actions that explain it. A quotation request might be the main action, while reading service conditions and viewing an application example help interpret that request.
Reduce friction without sacrificing information quality. A short form may increase inquiries but attract unsuitable requests if it removes every qualification question. Conversely, asking for details that are not needed yet may prevent someone from starting. Choose the minimum information required for the next step and explain why it is collected and how it will be used. Test the clarity of the call to action, page speed, and consistency with the advertisement. If an ad promises a guide but the page hides it behind a mandatory call, you are also measuring the effect of changing the promise.
Convert: define the outcome before counting it
At Convert, interest becomes an outcome the organization wants. It may be a completed purchase, a paid subscription, a signed contract, or an attended appointment. Agree on that definition before launching the report. A submitted booking form is not attendance, a confirmed booking is not a completed service, and a recorded order is not necessarily collected revenue. All these steps can be measured, but they need clear names so that intermediate indicators do not become final results in a management presentation.
Walk through completion in practice: are the price and additional charges clear? Do payment methods work? Are available appointments genuine? Can the customer understand the next step? Connect quality to the outcome, such as delivered orders after cancellations and returns, or completed services without substantiated complaints. An improvement that raises completion today but increases cancellation tomorrow may move the problem rather than solve it. Track a fast early result and a mature final outcome, showing the time lag between them.
Engage: the relationship after first conversion
Relationship development begins with delivering the promise, not sending another promotional message. Instructions, accessible support, accurate delivery, and clarity about what happens next all influence willingness to return. A product may need good onboarding during the first week, while a service may require appropriate follow-up and answers to questions. Choose communications that genuinely help the customer and respect preferences about channels and frequency. A high message count is not evidence of a strong relationship.
Choose a measurement window appropriate to the purchase cycle. Repeat coffee purchases within a month may be meaningful, while assessing repeat purchases of a household appliance over the same period is not useful. Follow cohorts of customers who purchased during the same period and compare their return behavior after equal time has elapsed. Do not compare customers observed for ninety days with people who joined yesterday. Outcomes can include retention, repeat purchasing, referrals, and satisfaction, but each measure answers a different question, and follower counts do not replace them.
A shared operating map across teams
Create an internal table with four rows, one per stage, and columns for the objective, desired behavior, content, channel, owner, and measure. The acquisition team may own Reach, but destination quality requires content and product collaboration. Operations or sales may lead improvements at Convert, while marketing supplies data about demand sources. A single follow-up owner does not remove responsibility from other teams; the aim is to prevent problems from disappearing between departments.
For each row, write down a decision that data could change. If visits increase without more people reading details, review targeting and page consistency. If qualified requests increase without additional sales, investigate the offer, response, and ability to complete. If sales improve but repeat purchasing declines, review experience quality and the advertising promise. A useful meeting ends not with a description of numbers, but with a specific hypothesis, an action, an owner, a review date, and evidence that will determine whether the experiment succeeded or failed.
Channels are not fixed stages
The same channel can serve several stages. A video explaining a new problem supports Reach, one comparing two options may support Act, and a verified account of product use may help a purchase decision. Email can deliver a guide before a sale or instructions afterward. Therefore, do not put only a channel name in the plan: specify the message, audience, and intended behavior. This prevents confusion between buying advertising space and designing a complete journey.
Connect paid, owned, and earned channels in practical terms. An advertisement may bring someone to an owned page, after which the visitor opts into content, returns later, and shares an honest experience. Do not assume that you control earned coverage as you control a website page. Likewise, do not treat retargeting as an automatic answer to every obstacle. The barrier might be an unsuitable price, missing information, or a poor experience, and repeated advertising alone will not repair it.
Connecting RACE with the seven-part marketing mix
The course asks learners to map the 7Ps onto RACE. Start with product, price, place, and promotion, then add people, process, and physical evidence. At Reach, promotion and physical evidence help explain the offer and establish realistic expectations. At Act, product information, price clarity, and process simplicity matter. At Convert, service availability, staff competence, and sound procedures become direct factors. After purchase, product quality, support, and experience influence return behavior.
Every element need not appear with equal weight at every stage. Select the elements that explain the current barrier. If people stop because the final price appears late, the issue concerns price and process, rather than necessarily a shortage of awareness content. If the offer is clear but appointments are unavailable, review access and operating capacity. This connection discourages calling every commercial problem an advertising problem and makes the marketing plan more closely reflect what the organization can actually deliver.
A measurement dictionary: count, denominator, and period
Write every rate so that another person can reproduce it. The initial-action rate might equal visitors completing the defined action divided by qualified visitors during the same period. Lead conversion might equal customers achieving the final outcome within a defined cohort divided by leads in that cohort. Do not use website sessions as the denominator and duplicated people as the numerator without explanation; mismatched units can produce a misleading figure.
Also distinguish percentages from percentage points. Moving from 10% to 12% is an increase of two percentage points, or relative growth of 20%. When calculating acquisition cost, state whether you use advertising expenditure alone or the full acquisition cost. When showing returns, distinguish revenue from profit. Advertising return can be high while contribution margin is weak because of product, fulfillment, and return costs. Precision in definitions matters more than an attractive dashboard.
Hypothetical example one: a homeware store
Assume a store runs a one-month experiment, with the following figures used for teaching rather than as market benchmarks. The campaign attracts 10000 qualified visits at an advertising cost of SAR 12000. Of those visitors, 2000 complete the main action: adding a suitable product to the basket after reading its details. A total of 300 orders are delivered, averaging SAR 250 each. We assume these three hundred orders belong to unique new buyers and that known cancellations and returns have been removed before calculation.
The initial-action rate is 2000 ÷ 10000 = 20%. The transition from basket to delivered order is 300 ÷ 2000 = 15%. Overall conversion from qualified visit to delivery is 300 ÷ 10000 = 3%. Revenue is 300 × 250 = SAR 75000, and return on advertising spend is 75000 ÷ 12000 = 6.25. Advertising acquisition cost is 12000 ÷ 300 = SAR 40, but this is not the full acquisition cost.
If contribution margin before advertising is 30% of revenue after the assumed variable costs, it equals SAR 22500. Subtracting advertising leaves SAR 10500 before fixed costs, taxes, and any items excluded from the definition. This detail prevents SAR 75000 from being described as profit. We then follow the same buyers for ninety days: if 60 purchase again, the cohort's repeat-purchase rate is 60 ÷ 300 = 20%, not the share of repeat customers in all sales during a later month.
How should we choose an improvement in the retail example?
Assume an order review identifies abandonment after delivery charges appear. The hypothesis is that displaying delivery costs earlier will reduce surprises and increase completion among interested shoppers. Test a version showing charges on the product page while keeping the product, base price, and traffic sources as consistent as possible. Measure delivered orders, contribution margin, and complaints, not merely clicks on the payment button. Basket additions may decline because some visitors learn the cost earlier, while order quality improves.
For arithmetic illustration only, if basket completion rises from 15% to 18% while baskets remain at 2000, orders become 360 rather than 300. That is 60 additional orders and hypothetical incremental revenue of SAR 15000 if average order value is unchanged. It is neither a guaranteed forecast nor an experimental result. A suitable test must be run, uncertainty assessed, and changes in mix and returns monitored. Holding other variables constant is a learning assumption that may not hold so neatly in real operations.
Hypothetical example two: booking a clinic service
Assume an awareness campaign for a clinic service, without making claims about treatment effectiveness or using real patient information. The campaign produces 4000 qualified visits to the service page, and 320 people submit valid contact requests. The team reaches 240 of them, 120 confirm appointments, and 90 attend. Advertising expenditure is SAR 9600. Each count represents unique people within the same cohort, with clear follow-up statuses rather than repeated messages being counted as new leads.
The contact-request rate is 320 ÷ 4000 = 8%. The contactability rate is 240 ÷ 320 = 75%. Confirmed appointments represent 120 ÷ 320 = 37.5% of all requests, but 50% of people successfully reached. Attendance among confirmed appointments is 90 ÷ 120 = 75%. Advertising cost per request is SAR 30, cost per confirmed booking is SAR 80, and cost per attendance is approximately SAR 106.67. These are different measures whose names cannot be used interchangeably.
If the report shows only cost per request, performance may look better than the operating team's experience suggests. RACE reveals relatively appropriate reach and transitions requiring investigation between request, contact, booking, and attendance. Rates alone cannot establish the cause. Review a permitted sample of reasons for difficulty: an unsuitable request, inconvenient contact timing, an unavailable appointment, or unclear information. Then choose one testable improvement while protecting privacy and keeping health details out of advertising platforms.
Improve service without inappropriate pressure
In the preceding example, possible tests include displaying available appointments clearly, confirming the preferred contact method, and sending an appropriate operational reminder to those who consented. A repeat medical visit should not be treated as a marketing objective independent of genuine need. In healthcare, relationship development may mean understanding instructions, easy access to support, satisfaction with the service, and completing follow-up recommended by a clinician. Care quality and freedom of choice take priority over attempts to maximize visit counts.
Separate necessary service communications from marketing, and review consent and privacy requirements with the relevant specialists under applicable rules and policies. A marketing framework does not authorize sensitive-data collection or targeting based on health status. Use aggregated information when it is sufficient, and define access rights and retention periods. Make accurate, verifiable promises without guaranteeing treatment outcomes or using people's stories without appropriate permission. These are execution safeguards, not details to postpone until the campaign ends.
Track the journey across the website and sales
To make the map measurable, agree on event names and meanings. Distinguish viewing a service page, submitting a valid request, confirming an appointment, attendance, and cancellation. Maintain an identifier that supports deduplication within the authorized system, and record the date of each transition instead of overwriting previous statuses without a trace. This allows analysis of time between steps and prevents an old request that converts today from being treated as a new request. Recording quality is shared work for marketing, technology, and operations.
Use source, medium, and campaign data consistently, but do not treat an attribution model as complete causal truth. Someone may see content, search for the brand, and then call. Different tools will allocate the result differently, and some touchpoints may be invisible. State measurement limits, compare trends with independent operating records, and use appropriate experiments when estimating incremental impact. A tracking link does not prove that the campaign alone caused the decision.
A dashboard that supports decisions
Keep the dashboard short enough for the team to read and detailed enough to interpret the outcome. For each stage, show counts, rates, and costs where relevant, alongside comparison with a comparable period. Add guardrails such as cancellations, complaints, and lead quality. Use a few meaningful breakdowns by segment, service, channel, or device rather than dozens of filters that make finding a convenient story easier than finding a sound explanation.
When a number changes, check the data first, then sample size and mix. The overall rate may improve because the share of returning customers increased without any improvement in the new-customer experience. Attendance may rise because capacity increased, not because of new advertising copy. Record important operating events beside the chart, such as price changes, payment outages, or stockouts. The report then becomes a learning record, reducing the temptation to credit marketing for every success and another team for every problem.
A practical exercise and short action plan
Choose one product or service and one segment, then write the promise and final outcome in two lines. Draw the four RACE rows and enter the customer behavior, question needing an answer, helpful content, suitable channel, owner, and one main measure in each row. Add two elements of the seven-part marketing mix that appear relevant to the current barrier. Do not begin with ten activities; choose one weak-looking transition for which enough information exists to understand it.
In week one, review definitions and recording quality, and walk through the journey yourself. In week two, analyze a sample of cases and form a clear hypothesis. In week three, implement a limited change with an appropriate comparison method. In week four, review the final outcome and guardrails, then decide whether to expand, revise, or stop. This is an illustrative organizing period, not a promise that every experiment will yield an answer within a month; some sales cycles require longer observation and larger samples.
Set priorities when resources are limited
If the team is small, do not turn RACE into four separate campaigns requiring four full budgets. Start with a path offering a clear opportunity and realistic execution capacity. Improving one page and clarifying the booking step may be more valuable than opening a new channel. Classify ideas by potential impact, confidence in the evidence, effort, and risk. This is an initial way to organize work, not a scientific formula producing a certain ranking. Document why you made the choice so it can be reviewed when results emerge.
Assess the improvement's effect across the whole chain. More requests may look like a gain but become a burden if the team cannot respond. Faster contact may increase bookings without changing the advertisement. Reserve some resources for operational barriers rather than allocating the entire budget to buying reach. When proposing higher expenditure, explain how later stages will handle the new volume and which early indicator would make you stop expanding before quality deteriorates or costs rise.
When is the framework insufficient on its own?
RACE helps organize execution, but it does not automatically determine which market to enter, which product to develop, or which price delivers fair value. Those decisions require research and understanding of competition, costs, and demand. The underlying problem may be an offer that does not solve an important need, difficult service access, or promises the organization does not fulfill. In such cases, improving the page or adding follow-up messages will not compensate for missing core value and may increase the number of negative experiences.
Some journeys also prevent individual-level measurement of every step because of privacy, multiple devices, or offline transactions. The framework can still help through aggregated data, interviews, and operational observations, provided inference limits are acknowledged. Do not fill gaps with invented numbers or request personal information merely to complete the diagram. A useful framework helps you ask a more precise question; the answer requires appropriate evidence and a decision that respects the customer and the nature of the business.
Review questions and the standard for a good answer
Ask yourself whether you distinguished an initial action from a final conversion. Does every rate have a clear denominator, period, and unit? Can you connect the activity with a specific barrier? Do you know who will implement the change and monitor its effect? Is the return measure appropriate to the product? A good answer goes beyond placing a platform name under each stage: it explains why the audience needs the message, what behavior is expected, and what would change your decision if the result does not appear.
Then revisit the examples: why does the confirmed-appointment rate change when the denominator is 320 requests rather than 240 people reached? Why is advertising return not the same as profit? How could basket additions fall while commercial performance improves? The aim is to read relationships between numbers, not memorize the order of letters. Use RACE as a shared language for testing and improvement, and retain the freedom to change the map when evidence reveals a journey more complicated than the first diagram.
Sources and further reading
This lesson draws on the approved course file “Explanation of Digital Customer Experience,” physical pages 37–38 for stages and channels, and pages 54–56 for measures, the communications mix, and the exercise connecting the seven-part marketing mix. This is a reference to private course material, not a public download link. The examples, calculations, and application plan in this lesson are original educational material.
For the original definition and accompanying planning, see Smart Insights' explanation of RACE. To connect this lesson with earlier planning in the series, see the SMART objectives guide, the marketing mix guide, and the McGuire persuasion model. Use sources to clarify concepts, then base decisions on the organization's actual data and limitations.
Comments
No published comments yet.