
A publisher does not need the largest possible number of advertising requests. It needs a sustainable way to fund useful content while giving advertisers a reason to return and readers a reason to stay. Those goals overlap, but they are not interchangeable. A technical change can improve one part of the system while weakening another, so the headline result should begin an evaluation rather than finish it.
OzoneOS provides a timely occasion to examine that distinction. The short factual digest below describes the announcement. All subsequent frameworks, calculations and decision rules are original practical analysis, not disclosed Ozone capabilities, observed customer results or instructions from the company. The central question is whether a publisher can demonstrate better economics without simply moving costs or disappointing another participant.
What Ozone announced and what remains unknown
Ozone publicly announced OzoneOS on November 10, 2026, after unveiling it to publisher partners at its CTRL event in London on October 22. Initial capabilities are being introduced across the UK and US. The company describes audience models combined with orchestration of ad layouts, page behavior and demand partners, bringing first-party audience intelligence into programmatic pricing, distribution and enrichment decisions.
In an unnamed major global publisher example, Ozone reports revenue per page rising 63%, viewability improving 66%, ad requests falling 69%, prices paid by buyers reaching three times the previous level, and brand count increasing 15%. These are vendor-reported case claims. The announcement does not disclose the publisher, test duration, sample, baseline definitions, control design or statistical uncertainty. It is not an independent causal evaluation or a forecast for other publishers. Source: Ozone’s announcement.
Give every number a named unit
Start the evaluation with a small measurement dictionary. An ad request, a bid, a filled impression, a viewable impression and a page visit describe different events. Ask the relevant technical owner which system records each event, when it is recorded and whether a retry or refresh creates another record. A dashboard can be perfectly consistent with its own rules yet answer a different question from the one a commercial leader thinks it answers.
The same discipline applies to percentages. A relative improvement in viewability is not an increase of the same number of percentage points. A price that becomes three times its earlier value has risen by 200%, not 300%. Neither statement tells the reader what was bought, how the baseline was constructed or whether comparable inventory was involved. Write the numerator, denominator and comparison period next to the figure before discussing what caused it.
Fewer requests should therefore remain a technical observation until their consequences are traced. They do not automatically mean fewer displayed advertisements, fewer paid impressions or a cleaner page. Similarly, viewability is not direct evidence of attention, persuasion or sales. Teams should resist renaming one available signal as the business outcome they wish they had measured. Retaining the original unit makes later disagreement easier to investigate and keeps claims proportional to the evidence.
Build a transparent publisher revenue bridge
For an original diagnostic, define net advertising revenue per eligible page as total net advertising revenue divided by eligible page views. Specify the deductions included in net revenue and the page eligibility rules before calculating either period. A publisher may use other accounting conventions, but it should label them clearly and avoid comparing a gross result on one side with a net result on the other. Report the total alongside the ratio.
Consider a hypothetical example, not an Ozone result. A publisher records 100,000 eligible page views and 500 currency units of net advertising revenue, or 0.005 units per page. A later period records 80,000 eligible page views and 480 units, or 0.006 units per page. Revenue per page rose 20%, while total revenue fell 4%. Both statements are correct. Neither alone explains whether the change is desirable or whether the technology caused it.
The next question is what changed around that ratio. Traffic volume, audience composition, content mix and commercial demand can all alter the interpretation. Keep a reconciliation showing eligible pages, excluded pages, gross receipts, deductions and net receipts for each comparison group. If an exclusion rule changes, recalculate comparable periods or show the discontinuity explicitly. The goal is not a more impressive spreadsheet; it is a result that finance, editorial and commercial teams can interpret together.
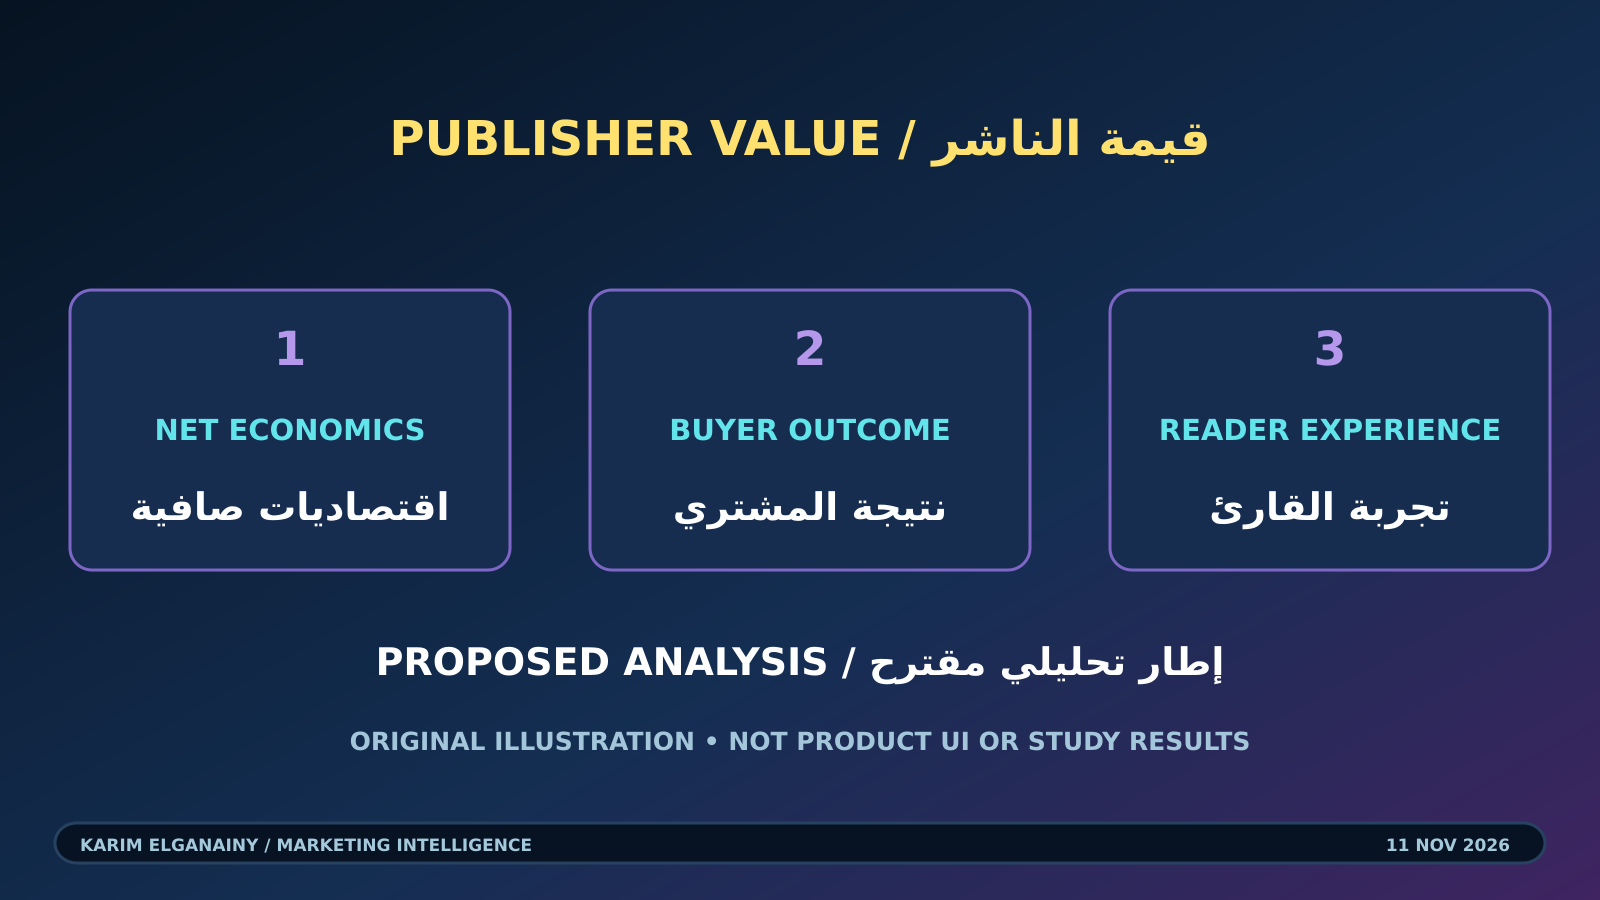
Original illustration by Karim Elganainy. Original analytical illustration: three panels labeled in Arabic and English for Net Economics, Buyer Outcome and Reader Experience frame a sustainable media decision. This is an editorial framework, not OzoneOS interface imagery, product architecture or a chart of measured results. News context: Ozone’s primary announcement. This artwork does not reproduce source imagery or depict reported results.
Design a pilot that can survive ordinary variation
Choose the eligible traffic and decision criteria before the pilot begins. Where practical, use a contemporaneous comparison rather than assuming that last month is a neutral benchmark. The appropriate assignment unit depends on the technical setup and the risk of one group affecting another. A small test should still have an owner who can explain assignment, exposure and exclusions. If a clean comparison is impossible, state that limitation rather than converting a before-and-after difference into proof.
Record device, geography, article mix, traffic source and calendar effects so that obvious composition changes do not disappear inside an average. Do not remove an inconvenient segment after seeing the result unless there is a documented data-quality reason. Show the overall result and meaningful segments together. A large improvement concentrated in a narrow, unusual audience can still be useful, but it supports a narrower deployment decision than a consistent improvement across the publisher’s normal traffic.
Plan the analysis window around the actual decision, including enough time to observe ordinary fluctuations and reconcile revenue. There is no universal duration supplied by this announcement. Agree in advance how incomplete receipts, outages and measurement failures will be handled. Keep uncertainty visible, even when the dashboard presents tidy numbers. A pilot is most useful when it reveals the conditions under which a change works, rather than simply producing a favorable slide for a meeting.
Treat reader experience as a release condition
Reader safeguards should be concrete enough to stop a rollout. Choose measures such as page latency, abandonment and return visits, with definitions appropriate to the publisher’s product. Check their collection method and denominator just as carefully as revenue. A faster average page can conceal a problematic experience for a particular device or connection. A short-term increase in receipts is not sufficient evidence that readers will tolerate the arrangement over repeated visits.
Add a structured qualitative review of representative page types. Inspect how advertising and editorial material coexist, whether the reading flow remains usable and whether the design makes important controls understandable. Record the device and page state so that another reviewer can reproduce the observation. These checks are recommendations for a publisher’s own pilot, not claims that a vendor automatically measures or fixes every usability issue. They complement behavioral data rather than replacing it with personal taste.
Set a response for a safeguard breach before it occurs. The team might pause expansion, inspect the affected page template or revert a clearly identified change while investigating. Assign the release decision to someone with authority across commercial and product concerns. Without that agreement, a reader metric can become a decorative line that everyone acknowledges and nobody acts on. The purpose of a safeguard is to constrain a decision, not merely to accompany it.
Ask buyers to demonstrate value on their own terms
A publisher’s gain does not establish an advertiser’s gain. Buyers need to understand the placement, supply path, total cost and outcome definition used in their own evaluation. More expensive inventory may be worthwhile, but its contribution must justify the expense. A higher clearing price by itself is evidence of a transaction price, not evidence of stronger incremental profit. Keep publisher receipts and buyer effectiveness in separate parts of the scorecard until a valid connection is demonstrated.
For a hypothetical buying decision, compare the same clearly defined objective under reasonably comparable conditions. A buyer might examine qualified reach or a downstream action, provided the measurement is appropriate and the limitations are visible. Account for costs beyond the headline media rate where relevant. Do not compare a broad awareness placement with a narrowly selected conversion audience and attribute the entire difference to supply quality. The population and purpose matter as much as the price.
Ask what evidence would cause the buyer to renew, reduce or stop the investment. That question makes the evaluation actionable without promising sales that have not been measured. Where causal business impact is the aim, use an appropriate experimental or otherwise defensible comparison rather than assuming that an attributed outcome was caused by the placement. If the buyer cannot measure the desired outcome yet, document the intermediate signal honestly and identify the missing step instead of inventing certainty.
Diagnose disagreement instead of averaging it away
A shared scorecard should preserve disagreement. Suppose publisher revenue per page improves while a reader safeguard deteriorates. That is a trade-off requiring investigation, not a success that can be declared by averaging unrelated metrics. Suppose buyer outcomes improve but publisher net revenue falls. That may identify a pricing or cost problem rather than a failure of audience quality. The useful response is to identify the specific constraint and the person responsible for resolving it.
Prepare a small set of diagnostic questions for the review meeting. Was the denominator stable? Did an audience segment become more common? Did costs move outside the reported revenue figure? Were the same outcomes available for both comparison groups? Was a measurement rule changed during the test? These questions are deliberately ordinary. They often matter more to a defensible decision than adding another sophisticated index whose components nobody can explain to the people funding the work.
Keep an exceptions log with the date, affected traffic, suspected mechanism and resolution status. Distinguish a confirmed explanation from a plausible hypothesis. If the team changes several settings to fix a problem, record that bundle rather than attributing a subsequent improvement to whichever component sounds most persuasive. This habit does not make every study causal, but it prevents a confusing operational history from becoming an overly simple story when results are presented later.
Expand only within the conditions actually tested
A useful release note should state the eligible inventory, observed economics, buyer evidence, reader safeguards and unresolved limitations in plain language. Include the decision owner and the next review point. Avoid describing a limited pilot as a universal transformation. When expansion reaches a different device mix, geography or content environment, treat that move as a new condition to verify rather than an automatic extension of the original result. Availability and suitability are also separate questions.
The procurement conversation should follow the same discipline. Ask for the definitions, access requirements, operating responsibilities and commercial terms needed for the publisher’s own assessment. Do not infer local availability, legal compliance or contractual protection from a launch announcement elsewhere. Have the relevant organizational reviewers assess the actual proposal. The article’s framework can organize questions, but it cannot substitute for a publisher’s technical review, commercial diligence or context-specific professional advice where needed.
The strongest conclusion is deliberately modest: fewer advertising requests can coexist with better economics, but the request count is not the destination. A publisher should be able to explain what improved, for whom, under which conditions and at what cost. Keeping publisher value, buyer value and reader experience distinct makes that explanation more credible. Only then can a technical change become a sustainable operating decision rather than a percentage that briefly wins attention.
Comments
No published comments yet.