A product's age is not its strategy
A product can be ten years old and still be growing in a new market. Another can be only six months old and already face falling demand. This is why the product life cycle is useful only when we treat it as a decision framework, not a calendar. It asks how adoption, demand, competition and economics are changing, then connects those changes to the work marketing and operations should do next. The objective is not to give every product a permanent label. It is to make a better investment decision with the evidence available today.
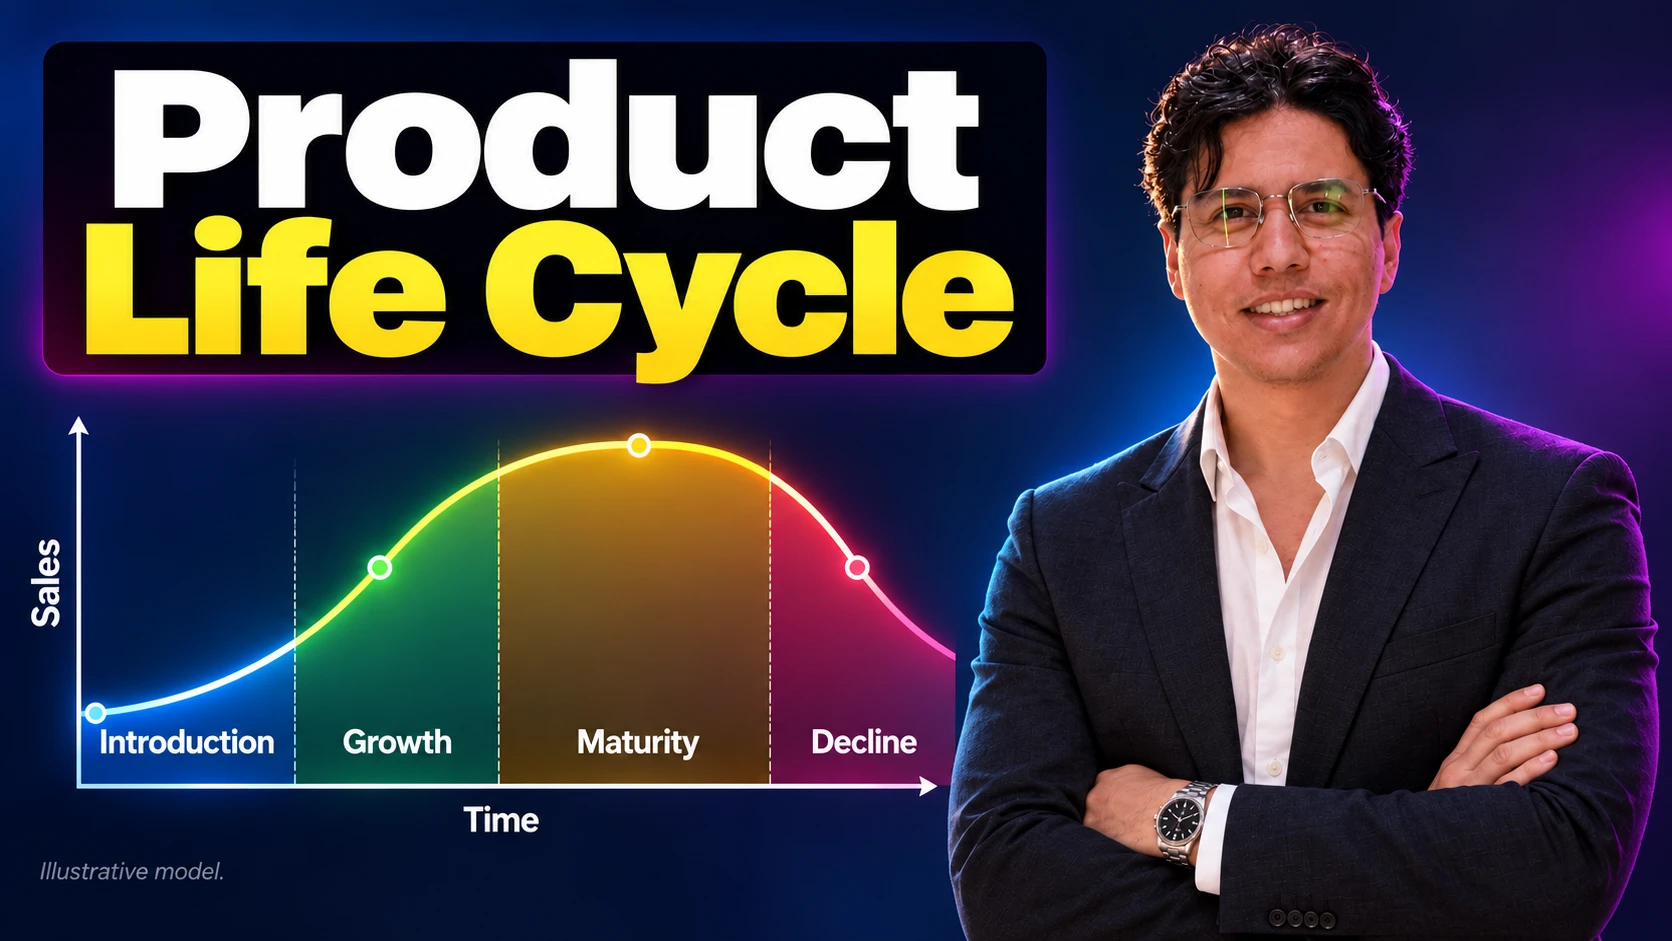
The familiar model describes four stages: introduction, growth, maturity and decline. A simplified illustration usually places time on the horizontal axis and sales on the vertical axis. Sales start small, accelerate, stabilize and eventually fall. That drawing is a teaching device. It is not a forecast, and equal widths do not mean equal durations. Some products never establish demand. Others enjoy long mature periods, return to growth after a meaningful change, or experience several waves across different segments. Actual profit can follow a different path from sales.
In practice, the most useful question is: what problem are we trying to solve at this stage? During introduction, the obstacle may be understanding and trial. During growth, it may be capacity and consistent delivery. During maturity, it may be retention, differentiation and efficiency. During decline, it may be choosing among renewal, a profitable niche and responsible withdrawal. Each choice needs evidence. A persuasive presentation cannot substitute for a sustainable product or a reliable operating model.
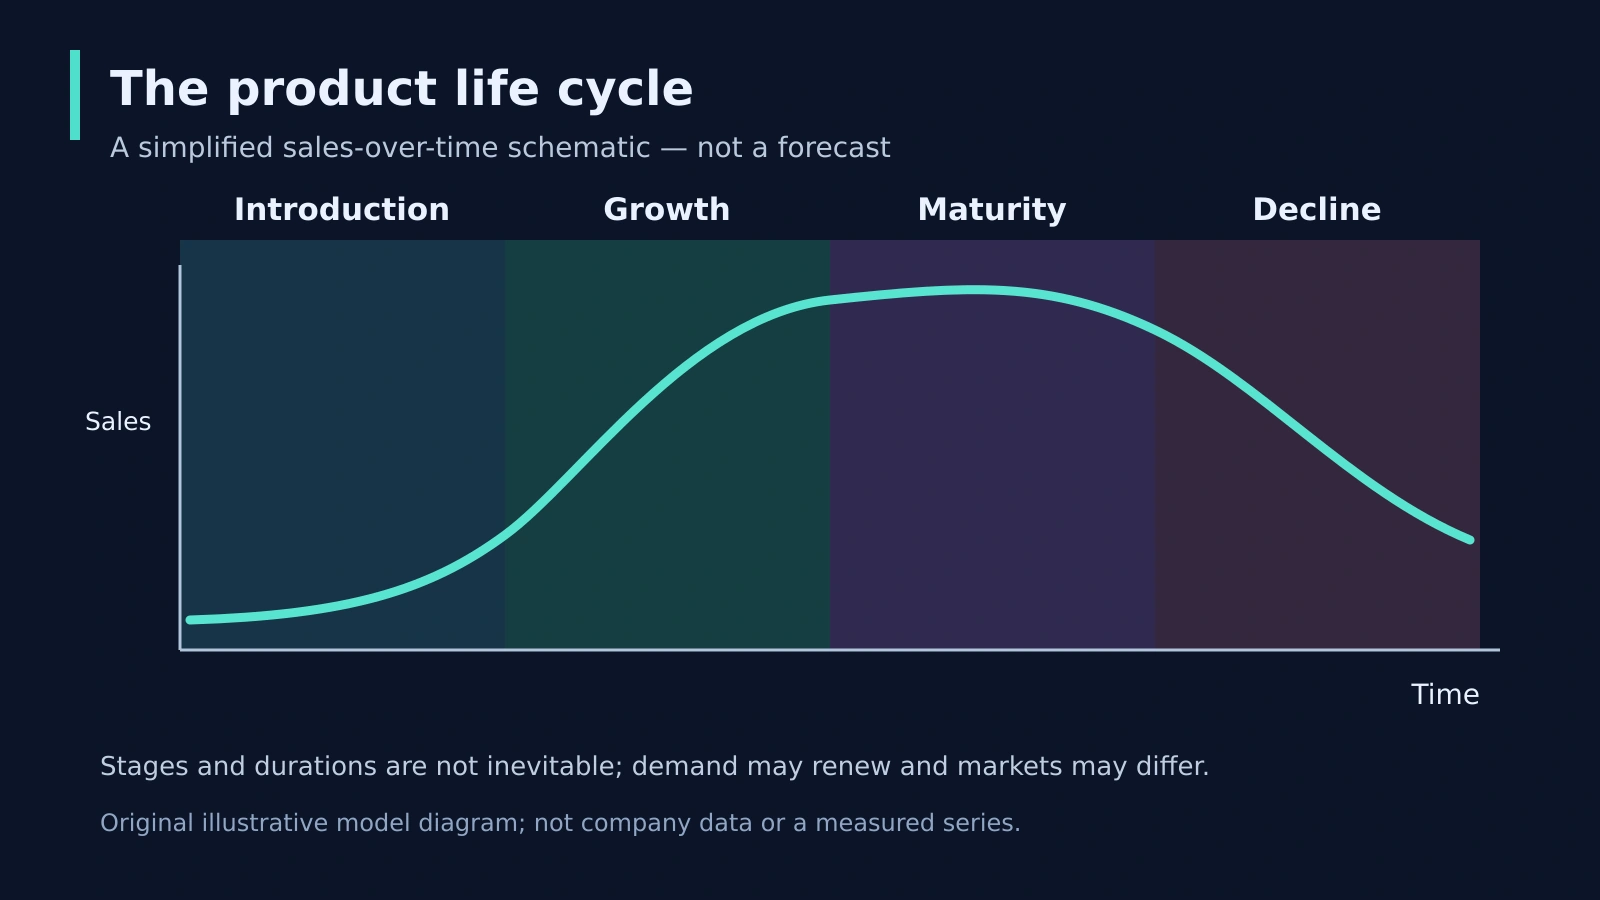
Original educational product life cycle diagram: a conceptual curve without sales values or predicted stage durations. Teaching sources are identified in the sources section.
What the course explains, and what this article adds
The source material is the Arabic explanatory course collection attributed to London School of Business Administration and Jenna Tiffany. The digital marketing strategy document explains the four stages on physical PDF page 92 and illustrates product decisions through a historical Moschino example on page 121. The introduction to digital marketing document covers the stages on physical page 124. Those are physical page references, not slide numbers. These passages connect a product's situation to targeting, communication, capacity and differentiation.
This article develops an original operating method from that teaching framework. The diagnostic checklist, measurement choices and two worked cases below are practical analysis, not claims that the course supplied those exact calculations or that a named business achieved those results. All numerical examples are hypothetical. The historical fashion illustration is not evidence of current Moschino sales, profitability or strategy. Keeping that boundary clear makes the framework more useful: we can learn from a model without turning a classroom simplification into an unsupported commercial fact.
Two qualifications matter immediately. Maturity can support profitability through scale and an established customer base, but it is not automatically the most profitable stage. Discounts, service costs and intense rivalry can erode its economics. Also, a long replacement cycle does not mechanically determine how long maturity lasts. Demand depends on the installed base, replacement needs, alternative solutions and market development. These are questions to investigate rather than rules to repeat.
Define the product and the market before naming a stage
Start with one sentence describing the unit of analysis. A category, a brand, a specific model and a version are not interchangeable. The category of reusable bottles might be established while a new bottle designed for a particular use is being introduced. A software category can mature while a new provider gains customers rapidly. If a team switches between these levels, almost any conclusion can appear plausible. Write the product, customer group, geography, channel and period above the chart.
Next, separate demand from the organization's ability to supply it. Falling orders can reflect stockouts, fewer operating hours, a broken checkout, weak distribution or an expired contract. Those conditions do not establish category decline. Conversely, sales growth caused by opening many additional outlets does not necessarily show improving demand per outlet. Compare like with like where possible. Record what changed in price, availability, assortment, distribution and promotional intensity before explaining the trend as a life-cycle movement.
Use a period that fits the purchase pattern. Weekly data can help monitor a rapidly purchased item, while an enterprise service may need a longer observation window because contracts close irregularly. Seasonal products require comparison with comparable seasons. There is no universal percentage that proves a stage. The diagnosis should combine the sales pattern with customer evidence, competitive changes and economics, and should include a confidence level. If evidence is thin, call the stage provisional.
Introduction: reduce uncertainty before buying more attention
Introduction means the particular offer is still establishing acceptance in its defined market. Potential customers may not understand the problem, the proposed solution, the difference from alternatives or the effort required to begin. Marketing's job is therefore more specific than generating reach. It must make the use case understandable, help suitable people evaluate it and identify barriers that prevent a first successful experience. A small number of useful customer conversations can be more informative than a large volume of unexplained clicks.
Demonstrations, clear comparisons, onboarding and limited trials can help, but they are not compulsory tactics. A trial that is expensive to deliver or attracts people with no realistic need may produce misleading activity. Decide what the trial is meant to teach. For example, can the intended customer complete the core task, understand the price and receive the promised service? Track activation and completed use, not registration alone. Record why eligible prospects decline and why some first-time buyers do not return.
Protect the budget with a learning plan. Define one important uncertainty, one experiment and the decision its result will inform. Establish the maximum acceptable cost and the operational conditions that would stop the test. Introduction is not permission to ignore economics indefinitely. It is permission to invest deliberately in learning, with explicit limits and an honest distinction between evidence of demand and enthusiasm from early supporters.
Growth: scale the promise and the delivery together
Growth is more than a rising sales line. The stronger signal is expanding adoption supported by repeatable acquisition and acceptable customer outcomes. New buyers arrive, distribution broadens and the organization gains evidence about which segments value the offer. The challenge changes from proving that anyone wants the product to proving that it can serve more appropriate customers without destroying the experience or the contribution generated by each sale.
This is where marketing must work closely with operations. Additional demand can expose weak inventory planning, support queues, inconsistent training and fulfillment delays. A campaign may improve acquisition numbers while increasing cancellations and complaints. Before increasing spend, examine capacity at the bottleneck, not merely total capacity on paper. Agree on a growth pace that delivery teams can support. Give customer-facing teams an accurate account of availability and limitations so that promotional promises do not run ahead of reality.
Growth also attracts alternatives. Refine positioning using actual customer evidence rather than assuming the initial message will work forever. Analyze cohorts to see whether newer customers retain as well as earlier ones. Track acquisition cost, contribution, repeat behavior and service quality together. If volume rises only because discounts deepen, describe that as a price-supported increase, not automatic proof of stronger product-market acceptance. Scaling should preserve the mechanism that made the offer valuable.
Maturity: defend relevance, not just market share
Maturity usually describes a market situation in which adoption is established and growth is slower. The task is not to stop investing. It is to choose investments more carefully. Retention, dependable service, availability, clearer differentiation and process efficiency can become more important than broad awareness. A familiar product may still be difficult to find, confusing to choose or frustrating to reorder. Solving those problems can be more valuable than launching another campaign with a new slogan.
Look at the customer base in segments. Some people may be highly loyal, others price sensitive, and others at risk because their needs have changed. Avoid treating all repeat customers as the same. Examine frequency, contribution and reasons for switching. Ask whether the product still performs the job customers value, whether competitors have changed the reference standard, and whether the organization is spending heavily to acquire customers who would have purchased anyway. These questions create better options than an automatic discount response.
Innovation at maturity can involve the product, packaging, service, channel or business process. Test the mechanism and the economics rather than celebrating novelty. A new bundle might increase order value while reducing total contribution or shifting purchases forward. An improved reorder flow might reduce friction without requiring a lower price. The right choice depends on the obstacle. Maturity is a reason to sharpen the diagnosis, not a reason to assume that every additional unit is profitable.
Decline: distinguish a repairable problem from a structural change
Decline describes a sustained weakening of demand within the defined scope, not one disappointing month. Investigate substitutes, changing preferences, technological shifts and the organization's own execution. A product can lose sales because customers no longer need its function, because a better solution exists, or because the offer is poorly distributed. These explanations lead to different decisions. Additional promotion may help a visibility problem, but it cannot reliably reverse the disappearance of the underlying need.
There are several legitimate responses. Renewal changes something meaningful about the offer or its relevance. A niche strategy serves a smaller group with continuing needs and viable economics. Harvesting limits new investment while honoring existing commitments and maintaining an acceptable experience. Withdrawal ends the offer with a responsible transition. None is automatically correct. Compare expected contribution, investment, operational complexity and obligations before choosing. Do not let historical effort become the only reason to continue spending.
A renewal hypothesis needs a test. Specify which customer problem remains valuable, what change will address it and what result would justify further investment. If the result is weak, retain the option to stop. When withdrawing, communicate availability, support and alternatives accurately. In service businesses, closure can affect trust beyond the discontinued offer. The life-cycle framework should improve decisions and transitions, not provide a convenient excuse to neglect existing customers.
A practical evidence-led workflow
Build a short diagnostic pack before discussing budgets. First, define the unit of analysis and the decision. Second, assemble comparable sales, customer and cost data. Third, mark events that could explain apparent changes, including price moves, distribution changes, stockouts and major campaigns. Fourth, collect qualitative evidence from customers, sales and support. Fifth, state the most plausible stage and at least one competing explanation. Finally, choose an action that will distinguish between those explanations or address the most important obstacle.
Assign an owner to every important metric and document its definition. Revenue is not contribution. A customer count is not an active-user count. An order is not necessarily a completed or retained purchase. Make returns, cancellations and delays visible. If the organization cannot reliably connect acquisition to outcomes, begin by fixing that measurement gap rather than producing an elaborate stage score. A simple, consistent dataset is more useful than a sophisticated dashboard with changing denominators.
End the meeting with a decision record: current diagnosis, supporting evidence, uncertainty, selected action, spending limit, operational guardrails and review date. State what would cause the team to revise its view. This protects the framework from becoming a label attached after the decision has already been made. The review should ask whether the mechanism worked, not merely whether the team completed the planned activity.
Worked example one: a new administrative booking service
This hypothetical example concerns a non-clinical booking administration service for small employers. It does not recommend clinical care, diagnose patients or claim medical outcomes. The defined offer helps an employer coordinate eligible staff appointments with participating providers. The pilot operates in one city with a limited set of appointment categories. The relevant unit is this administrative service for that customer group, not the entire healthcare market. Its initial situation is provisionally classified as introduction.
Suppose twenty employers attend a demonstration, eight start a pilot and five complete the first administrative workflow. These invented counts are useful because they reveal different stages of acceptance. Demonstration attendance measures interest; pilot starts measure willingness to try; completed workflows show that the process can be used. None alone proves ongoing commercial demand. The team interviews the three pilots that did not complete and learns, within this illustrative scenario, that responsibility for uploading eligibility information was unclear.
The next action is not automatically more advertising. The team tests a simpler onboarding checklist with a named employer coordinator and clear support responsibilities. It compares completion, time to first successful workflow and support effort with the initial process. Any information collected should be limited to the administrative purpose and handled through appropriately authorized systems. The example does not establish legal requirements or clinical suitability; those need qualified review in a real implementation.
For an illustrative economics check, assume a monthly fee of SAR 1,000 per employer and variable delivery costs of SAR 400. That leaves SAR 600 before acquisition cost, fixed overhead and other relevant costs. If acquisition costs SAR 1,800, dividing by SAR 600 suggests three months to recover acquisition spending only under the simplified assumption of stable fees, costs and retention. It is not a full profitability forecast. The team must test whether employers stay, service effort rises and cash collection occurs as expected.
The scale decision combines adoption and delivery. More employers are not useful if coordination errors increase or support becomes unsustainable. A reasonable next stage is a controlled expansion after the onboarding obstacle is resolved, with pre-agreed service safeguards. If users complete the workflow but do not renew, investigate ongoing value and pricing before declaring growth. The life-cycle diagnosis directs attention toward learning and repeatable delivery rather than turning a small pilot into a premature success story.
Worked example two: a mature reusable bottle range
Consider an invented retailer selling a reusable bottle range through established shops and an online store. Comparable annual unit sales are nearly flat, repeat purchasing is modest because the product is durable, and shoppers understand the category. The team provisionally calls the range mature in its existing market. It does not infer decline merely because customers do not buy another bottle every month. It also separates the established range from a new accessory that may be at an introduction stage.
Assume the bottle sells for SAR 80 and its relevant variable product and fulfillment costs are SAR 48. The simplified contribution is SAR 32 per unit before fixed costs and other excluded expenses. A proposed discount to SAR 64 reduces that contribution to SAR 16 if costs remain unchanged. The team would need twice as many units merely to preserve the same total contribution in this simplified calculation. Higher sales volume could therefore hide a weaker commercial result. This is why maturity should not trigger discounts without an economic test.
Customer interviews in this hypothetical case suggest that replacement lids are difficult to find and sizing information is unclear. The team considers two experiments: improve compatibility information and make genuine replacement components easier to order. The objective is to strengthen usefulness and reduce avoidable frustration, not to force unnecessary repurchase. It measures successful component orders, support questions, returns and contribution. A rise in customer satisfaction alone would not establish financial benefit, but it would help explain whether the service problem was addressed.
The retailer also tests one new use case with a small audience rather than relabeling the entire range as growing. If the new segment responds, the team reports that specific result and checks whether it is incremental or simply shifts purchases from another line. If demand remains flat but the range generates healthy contribution with manageable complexity, maintaining it may be a sound decision. If substitutes structurally reduce demand, the team can evaluate a smaller assortment or withdrawal. The framework supports both expansion and disciplined restraint.
Use other models without confusing their questions
The product life cycle describes a pattern of adoption and demand over time. The BCG matrix asks a different portfolio question using market growth and relative market share. A life-cycle stage does not automatically determine a BCG category. Ansoff helps frame growth directions through existing or new products and markets; it does not prove that a proposed expansion will work. STP helps identify whom to serve and how to position the offer. These tools can complement one another when their distinct assumptions remain visible.
Customer life cycle is another separate idea. A new customer can buy a mature product, and a long-standing customer can adopt a newly introduced offer. Do not replace customer journey evidence with a product-stage label. Awareness, evaluation, purchase and retention still need their own diagnosis. The useful connection is that the product's market context may change the questions customers ask and the proof they need, while their individual relationship with the business determines the immediate communication task.
Karim's practical takeaway
Use the life cycle to improve the next decision, not to make a chart look complete. Choose one clearly defined offer, inspect comparable evidence and write the most important unresolved question. Then connect the proposed action to that question, its economics and its delivery requirements. Keep a competing explanation visible and decide in advance when you will review the result. If the evidence changes, change the diagnosis.
My preferred output is one page that a marketing manager and an operations manager can both use: where we think the offer stands, what customers are telling us, what the numbers actually measure, what we will test and what would make us stop. That is a stronger application of the model than confidently placing every product on a smooth curve. The stage is a working hypothesis. The quality of the decision is the real deliverable.
Comments
No published comments yet.