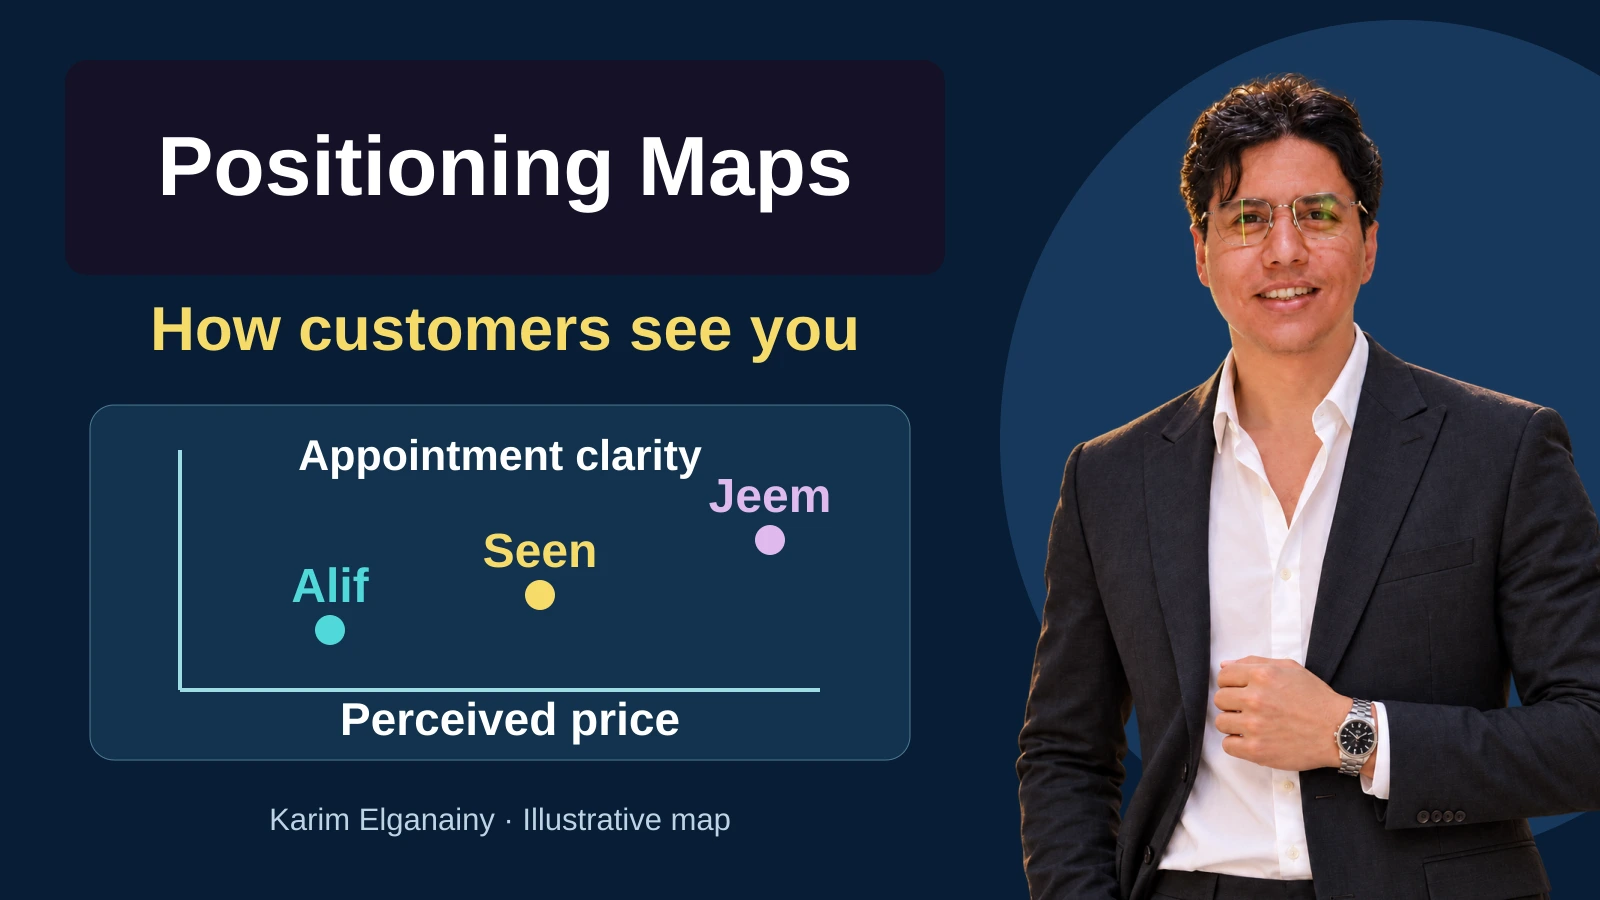
A business may describe its service as affordable and high quality, only to discover that customers cannot distinguish it from the alternatives. Another team may spend months improving a feature that buyers scarcely consider. A positioning map makes a more useful question visible: compared with the alternatives our audience actually considers, where does our offer stand on the criteria that matter, and what evidence supports that position?
This lesson explains how to construct a readable map, interpret it without overclaiming, and turn the findings into a decision and a test. Every service name, score, price, sample size and result in the worked examples is fictional and provided for learning. None is current market research, a recommended sample size or a promised business outcome. Real applications need evidence appropriate to their audience, market and decision date.
What a positioning map does
A positioning map compares offers or brands along defined dimensions. When the plotted locations reflect customers' beliefs or impressions, it is a perceptual map. Each point represents an offer within a stated audience, market and period. Its coordinates summarize the chosen variables. The diagram does not reveal everything in a customer's mind, certify product quality or describe the whole competitive environment. It makes a limited comparison easier to inspect.
Positioning itself is the strategic choice about the place an offer should occupy in a particular audience's mind relative to alternatives. Al Ries and Jack Trout's 1972 articles are important historical sources for this formulation. That attribution is not a claim that they invented every mapping technique or statistical method used to study perceptions. A map supports positioning strategy; it cannot make the strategic choice on the team's behalf.
The tool connects with segmentation, targeting and positioning, or STP. First establish whose decision you are studying. Buyer-persona work may help identify the task, constraints and comparison criteria, but a persona is not evidence of competitors' positions. Likewise, an attractive map does not establish that a segment is commercially worthwhile. Use the diagram when you have a specific comparative question, rather than creating one merely because a strategy presentation needs another visual.
Perceptions are not observed properties
Asking people how expensive a service feels produces a perception measure. Collecting actual prices for comparable packages produces an observed price comparison. These may disagree: a service can appear expensive because of its presentation while costing less once all charges are included. Neither measure is automatically wrong. They answer different questions, and placing them under one ambiguous label conceals that difference.
A map can compare measurable attributes, such as product weight and battery duration under a consistent test. It can also combine an observed property with a perception, provided each axis clearly identifies its source and unit. Do not call a listed price a feeling about price, or treat perceived reliability as measured failure frequency. The meaning of the evidence determines what the resulting point can support, even when the diagrams look similar.
The supplied course materials use examples involving price and quality, and exclusivity and affordability. Their purpose here is to explain comparison, not to provide a current ranking of airlines or fashion brands. Experiences differ across products, locations, customers and dates. Our original illustrations therefore use fictional services and narrowly defined variables, retaining the educational idea without presenting historical brand placements as contemporary research.
Define the parts before plotting anything
Give the map a title that identifies the audience, context and decision. “Perceptions of scheduled home-maintenance visits” is more informative than “Our competitive position.” The horizontal axis should describe one variable and explain what moving left or right means. Do the same for the vertical axis. A label such as “quality” is usually insufficient: it might mean workmanship, durability, arrival speed or staff communication. Name the property actually evaluated.
State the scale and unit. Scores from one to five, prices in a named currency and durations in minutes are different types of measurement. Explain both endpoints and use consistent spacing for the displayed values. Do not reverse an axis between diagrams without warning. Nor should the layout imply that the right-hand side is automatically better. A higher price may be acceptable to one audience and unsuitable for another, depending on benefits and alternatives.
Use a legend that connects each symbol with its offer. Letters or distinct shapes should accompany color so that readers can still distinguish the points when printed or when colors are difficult to separate. Keep marker sizes equal unless size represents a defined additional variable. An unexplained larger circle can imply greater market share or superior performance without evidence, even though its coordinates remain unchanged.
If you add midpoint lines, describe them as reference boundaries rather than automatic divisions between good and bad. Show a desired future position with a different symbol and label it “target” or “hypothesis.” A line toward that target represents a proposed direction, not movement already achieved. Include the data source, response counts, collection period and scope, and provide a written explanation of the important visual information.
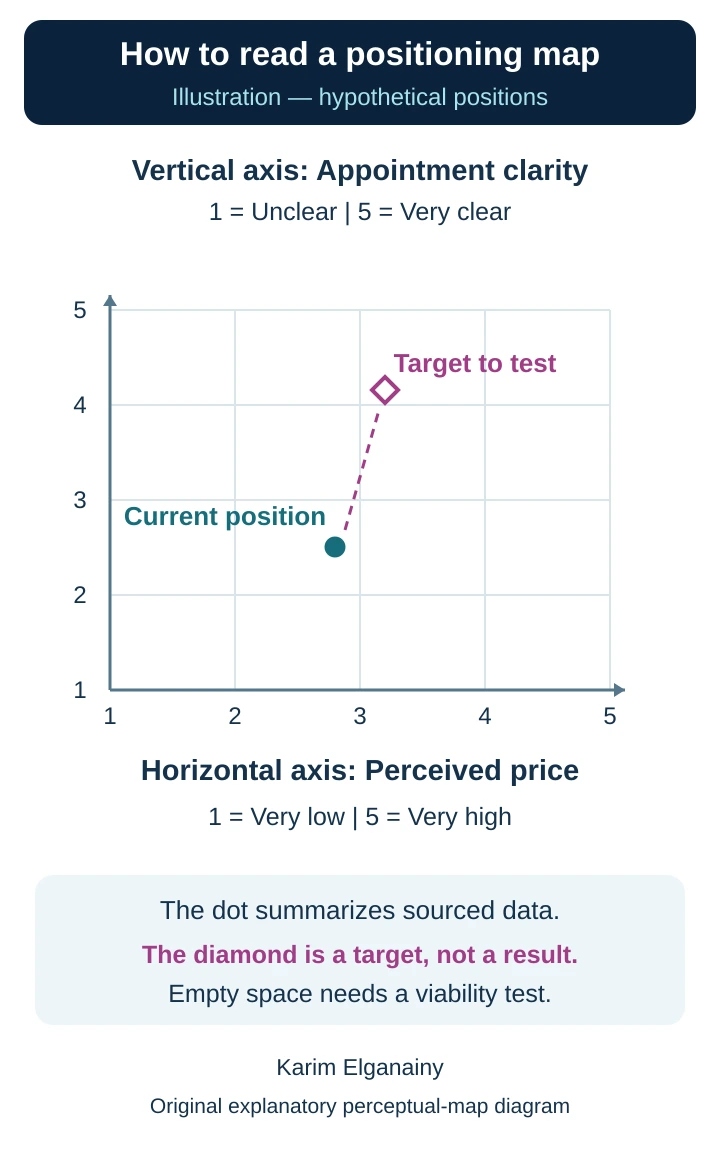
Reading the diagram: Check the axis definitions and increasing directions first. The circle summarizes example observations; the diamond is an unachieved illustrative target. The values are fictional, and empty space does not establish demand.
Choose axes that can inform a decision
Start with accounts of actual buying situations. Which alternatives did people consider? What made comparison difficult? Which difference affected their choice? A concrete recent situation is more useful than asking everyone whether quality matters. Most people can agree that quality is important while meaning very different things. Your task is to find a criterion participants can interpret consistently and the organization can act on honestly.
Check that the two axes contribute meaningfully different information. “Low price” and “low cost” may repeat the same idea unless you distinguish purchase price from the cost of ownership. Conversely, two criteria may be related without being identical. Complete independence is not the objective; a useful comparison is. Ask whether the diagram exposes a meaningful trade-off or simply repeats one ranking under two labels.
For an appointment-booking decision, clarity of the arrival window and ease of changing it may be more actionable than luxury and modernity. For business software, integration suitability and ease of learning a task may be relevant. Choose the criteria before seeing which combination flatters your own brand. Selecting axes after inspecting results solely to create an isolated corner turns analysis into a justification of a preferred story.
More than one map may be appropriate when the questions differ. One can compare perceived price and service clarity; another can examine usability and support. Keep the audience and context explicit in each. Avoid squeezing every factor into a single chart with many colors, marker sizes and arrows. A useful simplification clarifies a question; a misleading simplification hides a decisive factor while appearing comprehensive.
Select alternatives and gather comparable evidence
Ask what customers would do if your offer were unavailable. Their answer may be a direct competitor, an independent provider, doing the task themselves or postponing it. These alternatives deliver value differently but can compete for the same decision. A manager's familiar competitor list is only a starting point. Including a famous brand that does not serve the relevant task or location adds decoration rather than analytical value.
Define the comparison level: an individual package, a branch or an entire brand. Comparing a competitor's entry package with your premium package may reveal an obvious difference rather than an insight. For actual-price comparisons, specify included components, duration and conditions. For perceptions, explain what participants are rating so that one person does not imagine a basic service while another imagines a substantially different comprehensive offer.
Use neutral questions and allow “I don't know” when people lack enough knowledge. Do not convert that answer into a midpoint: lack of knowledge is not a moderate opinion. Record valid response counts separately for each offer and question, together with recruitment method and participants' experience. Responses from your social followers may describe your current audience better than the market you hope to enter, regardless of how many replies you obtain.
Pilot the wording and ask participants to explain the scale in their own words. Some may interpret “appointment clarity” as punctual arrival, while others interpret it as a clear booking message. Those are different variables. In this lesson, clarity means how clearly the arrival window is communicated when booking. Whether the technician actually arrives within that window remains a separate operational measure.
Worked example: a home-maintenance service
Imagine a fictional service called Seen that offers scheduled home-maintenance visits. The team wants to know whether clearer arrival information could create a meaningful distinction without making the service seem unjustifiably expensive. The audience consists of people choosing planned, non-emergency visits. Seen is compared with three fictional alternatives, Alif, Baa and Jeem. The findings would not automatically apply to emergencies or every maintenance category.
The horizontal axis measures perceived price: one means very low and five very high. The vertical axis measures clarity of the arrival window communicated at booking: one means not clear at all and five very clear. For this arithmetic exercise only, assume twenty valid ratings per service on each axis from people familiar with all four offers. This convenient assumption is neither a sample-size recommendation nor evidence of statistical representativeness.
Alif's price scores total forty and its clarity scores total forty-eight, producing coordinates of 2.0 and 2.4. Baa's totals are sixty-four and fifty-two, giving 3.2 and 2.6. Jeem's totals are eighty-eight and eighty-six, giving 4.4 and 4.3. Seen's totals are sixty-two and fifty, giving 3.1 and 2.5. The coordinate order is always perceived price first, then clarity.
Calculate each mean by dividing the relevant score total by the valid response count for that question. For Seen, sixty-two divided by twenty is 3.1; fifty divided by twenty is 2.5. Here the mean is a descriptive summary with a practical assumption about spacing between scale points. In actual research, also inspect the response distribution, median and suitability of the summary. Numerical presentation does not remove the judgment involved in ratings.
Seen and Baa sit close together on these two dimensions. Jeem appears higher on clarity and further right on perceived price. That does not establish that the small Seen–Baa difference is reliable or commercially meaningful; it may sit within response variation. Nor does Jeem's location make it the best overall service. This exercise has not measured workmanship, safety or whether the repair solves the customer's problem.
The team proposes a hypothetical target for Seen at perceived price 3.2 and clarity 4.1. Show it with an open diamond and a dashed connection from the current point, explicitly labeled as a target to test. The desired change is 1.6 clarity-score points and 0.1 perceived-price points. These are differences in rating summaries, not percentages of sales growth or promises that new copy will produce the target.
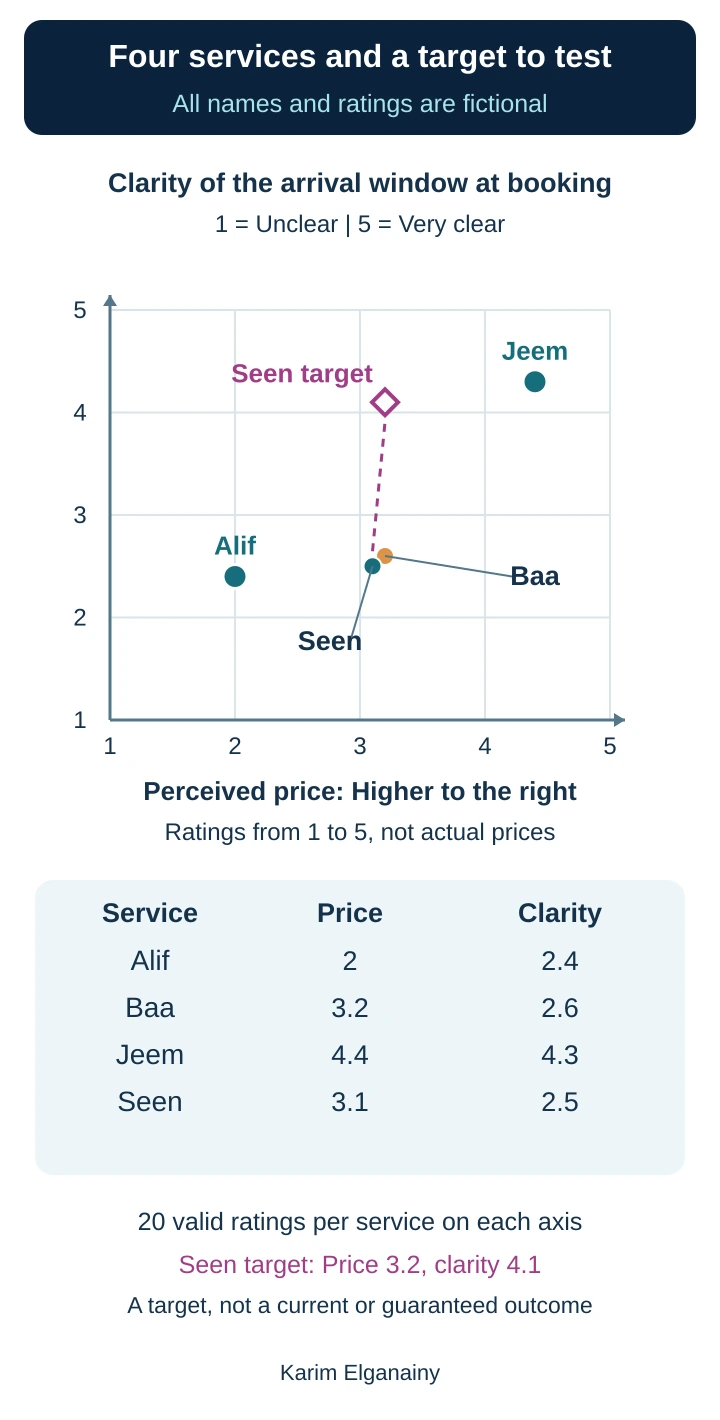
Reading the example: The four circles summarize fictional ratings. The diamond is the proposed target. Consult the accompanying values to distinguish nearby Seen and Baa. Both scales run from one to five, and equal symbol sizes do not represent market shares.
Turn the observation into a test
The first response should not be to buy advertising announcing clearer appointments. Seen should inspect its booking confirmation, arrival-window length, delay communication and rescheduling responsibilities. If operations cannot provide a dependable window, promoting certainty can widen the gap between promise and experience. The appropriate intervention may be better planning and communication before a stronger marketing claim, rather than moving a point on a slide.
Seen could run a bounded test of clearer visit-window information, cost explanations and what happens if the visit cannot proceed. Check whether customers understand the information, then review actual arrival performance, cancellations and complaints. Keep three outcomes separate: comprehension of the promise, operational delivery and commercial choice. A higher clarity score does not prove greater punctuality; more bookings do not prove that customers understood the conditions or that profitability improved.
In a separate fictional calculation, suppose each of two reasonably comparable periods contains two hundred suitable inquiries. Thirty-five become completed visits in the first period and forty in the second. Completion rates are 17.5 percent and 20 percent. The difference is 2.5 percentage points; the relative increase is approximately 14.3 percent. A before-and-after comparison alone does not prove causation, because seasonality, inquiry sources or staffing may also have changed.
Now assume an illustrative visit price of two hundred monetary units and a variable cost of one hundred twenty. Contribution before fixed costs is eighty per visit. If the appointment arrangement adds twenty to variable cost, contribution falls to sixty. Thirty-five visits at eighty produce 2,800; forty visits at sixty produce 2,400. Total contribution therefore falls by four hundred despite the higher visit count, before any additional fixed cost.
This calculation does not settle the initiative's value. Retention benefits or operational savings might exist but have not been measured in the scenario. It demonstrates why movement on a map cannot be equated with economic success. Define the evaluation period, costs and outcomes before testing, then interpret the evidence together. A different window, narrower service scope or clearer price explanation may be preferable to pursuing the original target unchanged.
What a single point can conceal
Twenty people can all give a score of three, producing a mean of three. Ten people can give one and ten can give five, producing the same mean. The first group agrees; the second is sharply divided. Preserve distributions instead of retaining only the final coordinates. Explore whether differences relate to experiences, segments or branches, but do not invent an explanation before examining the evidence.
When comparing segments, keep axis definitions and scale settings consistent. Different scales can make identical distances look different. State the valid response count in each segment, particularly when a small subgroup may fluctuate substantially. Treat divisions chosen after seeing the results cautiously, especially if they were selected to tell a convenient story. A segmented map is useful only when its grouping and limitations remain understandable.
Geometric distance is not a law governing customer switching. Two nearby points can conceal major differences in coverage, trust or payment options. When axes have different units, the apparent shape also depends on scale choices. Advanced statistical mapping methods can use richer similarity data, but require appropriate design and interpretation. A manually drawn two-axis chart is not equivalent to having performed those analyses.
Check the evidence behind the shape
Distinguish people who have heard of a brand from those who have used it. Both can answer useful but different questions. A study of pre-purchase impressions need not require previous use; a detailed assessment of service delivery should not ask non-users to report experiences they never had. State the required knowledge and do not merge these groups silently under a label such as customer experience.
Review question order and presentation. Showing an expensive alternative first may affect the comparison frame; describing only your own offer's strengths creates an uneven task. Present comparable information consistently and consider an organized variation of order when the study design warrants it. No single procedure eliminates every source of bias. Explain the collection conditions and what participants were actually able to assess.
Maintain a small audit table recording variable definitions, valid counts, exclusions, calculations and the source of each value. Establish cleaning rules before inspecting whether an exclusion improves your brand's position. An unexpectedly negative response is not automatically invalid. It may reveal an experience the team has not understood. Likewise, if using weights for segments, explain their source rather than inventing population proportions to produce a precise-looking overall point.
Empty space is a hypothesis, not a business case
An unoccupied corner combining low perceived price with extensive service may look attractive. It might instead be economically infeasible, unwanted by customers or already served by an alternative missing from the analysis. The selected axes may also omit the principal buying criterion. Absence of a point does not establish absence of competition, and it provides no direct count of potential buyers.
Test three linked questions: is there a specific need among an audience you can reach, can the offer be delivered with defined resources and conditions, and does the likely buying behavior support its economics? Interviews, concept testing and small operational trials provide different kinds of evidence. Interest in an idea and actual purchases are not interchangeable outcomes. A crowded region is not automatically impossible either; geography, distribution or service details may create value the map does not show.
Worked example: choosing work-request software
Consider a fictional organization comparing software for internal maintenance requests. Frontline users need to submit a request easily, technology staff need suitable integrations and permissions, and managers need to understand delays. A generic price-versus-quality map would obscure these roles. Start by mapping users' perceptions of learning the submission task and seeing request progress, while evaluating integration requirements in a separate checklist.
Walk through the decision rather than collapsing all opinions into one average. Give participants the same request-submission and status-checking tasks, collect their ratings with the same defined scales, and keep the groups identifiable. If an unfamiliar product has not been evaluated, record it as unassessed, not poor. A standardized demonstration can support a later evaluation, but label that evidence as post-demonstration assessment rather than pre-existing brand perception.
To make the example concrete, suppose ten employees perform the same guided task in three fictional programs called Raa, Saad and Taa. Each then rates ease of learning and clarity of request tracking from one to five: one means very difficult or very unclear, and five means very easy or very clear. Assume ten valid responses per program on each axis. These invented names, counts and results are for practice, not real product assessments or a sample-size recommendation. Label them as post-task evaluations, not prior market perceptions of the brands.
Raa's ease scores total forty-two and tracking scores twenty-eight, giving means of 4.2 and 2.8 after dividing by ten. Saad's totals are thirty-two and forty-one, producing 3.2 and 4.1. Taa's are thirty-eight and thirty-seven, producing 3.8 and 3.7. Plot ease horizontally and tracking clarity vertically. The fictional results show a trade-off: Raa is rated easiest to learn, Saad clearest for tracking, and Taa falls between them on both dimensions. These mean differences alone do not establish reliable superiority or predict every employee's choice.
Now suppose the separate requirements checklist finds that Raa lacks a mandatory permission control separating request approval from execution, while Saad and Taa meet it. The team excludes Raa from the current shortlist despite its ease score: the map cannot compensate for an essential operational requirement. If lost request visibility is the main problem, Saad proceeds to deeper testing alongside Taa rather than being declared the winner. Record Saad's potentially greater training need and investigate training, integration and support costs separately, without pretending participants rated variables they were never asked about.
For the next test, define a consistent task: submit a request, then identify its current owner and status. Observe unassisted completion, handover errors and training time. Recheck perceived clarity after use while preserving the distribution, not only the mean. If staff feel tracking is clearer but cannot locate the correct request, the gap between impression and performance needs investigation. If Saad requires training resources the team cannot provide, Taa may be more suitable despite a slightly lower clarity average. The final choice combines requirements, delivery capability, cost and behavioral evidence rather than selecting the point nearest the upper corner.
Connect the map to a credible message
Write an internal decision statement connecting the audience, task and difference you can substantiate. “We want customers to understand the visit window and rescheduling conditions before confirming” is more actionable than “We will own high quality.” Identify the evidence customers will see and the person responsible for maintaining it. Do not advertise a future target as a present capability. Promise what operations can currently deliver.
For Seen, possible evidence includes a sample confirmation, a clear statement of what the price includes and a practical explanation of delay communication. These are responses to the fictional problem, not a universal advertising formula. Test whether people understand the distinction without employee coaching and whether it helps them make an appropriate choice. Memorability alone is insufficient: people can remember a claim they neither believe nor consider relevant.
Present the data table, map and proposed decision together. Ask what evidence would change the conclusion. Later interviews might reveal that customers understand the timing but fear extra charges, suggesting a different axis or a clearer offer explanation. Retain that possibility rather than forcing every observation into the original narrative. Share enough methodological detail for scrutiny without exposing participants' names or unnecessary personal information; real studies also need appropriate review of applicable requirements.
Common mistakes and practical corrections
One mistake is placing your brand where management wishes it were, assigning competitors positions from intuition, then calling the chart the customer's voice. Label it an internal hypothesis map and specify how it will be tested. Another is combining concepts such as speed and convenience in one question. Separate them when they can differ, and define high and low ratings before collecting evidence.
Large logos, shaded areas and unexplained marker sizes can imply market shares that were never measured. Removing unknown responses without reporting the valid counts hides uneven familiarity. Historical teaching examples should not become current brand rankings. Small mean differences should not become certain competitive advantages. Date the evidence, disclose scope, separate observed and desired positions, and state which decisions require further investigation.
Avoid the tool when it would replace a necessary technical, operational or financial assessment. It is also a poor basis for claims about an audience you have not studied. You can still sketch a clearly labeled hypothesis to plan research, but the presentation must not upgrade speculation into measurement. The right question is not whether the chart looks finished; it is whether the reader can trace its conclusion back to defensible evidence.
A small-team application checklist
Begin with one decision, audience and context. Identify alternatives from customers' accounts and actual options. Review existing evidence, then select two understandable, relevant variables and write neutral questions with clear endpoints and an unknown option. Pilot the wording, document recruitment and maintain comparable questions across offers. This preparation is usually more valuable than polishing a graph before agreeing what it means.
Clean responses using stated rules, review missing data and calculate valid counts. Preserve distributions alongside the summaries. Plot consistently and check each coordinate against the calculation table. Ask someone who did not build the map to explain the axes, target and limitations. If that person confuses these elements, improve the presentation before treating misunderstanding as a reader problem.
Finish with one reviewable action, an accountable owner, an outcome measure and a measure protecting the customer experience. Retain a dated version and decide when to revisit it: after a material offer, audience or competitor change, or a suitable period for the market. Before attributing later movement to a campaign, examine differences in questions, participants and circumstances. The map should improve decisions, not become an unchangeable decoration.
Try the method yourself
Choose a service you know and three real alternatives for the same task. Define two axes and state whether each represents an observed property, a perception or an explicitly disclosed combination. If you have no collected evidence, create a hypothesis map and say so. Write what you know, its source and what remains unknown beneath each point. Add a clearly distinct target and a question that could make you reject it.
For a calculation exercise, use six valid ratings: two, three, three, four, four and five. Their total is twenty-one and their mean is 3.5. If two additional respondents answered “I don't know,” the mean's denominator remains six. Report that six of eight respondents could assess the attribute, or seventy-five percent. Familiarity and the attribute rating are different measures; do not substitute one for the other.
Give the map to a colleague and ask which decision it informs, which alternatives are close on its dimensions and which claim it cannot establish. Agree on one action that gathers new evidence rather than merely relocating a dot. The practical takeaway is simple: a positioning map is valuable when it makes the relationship between evidence, comparison and action easier to challenge and improve.
Sources and attribution
The user-supplied educational materials for Jenna Tiffany's London School of Business Administration lectures: “شرح مقدمة التسويق الرقمي,” physical PDF pages 121–122, with a repeated reference on page 149; “شرح استراتيجية التسويق الرقمي,” pages 86–89, with another application on page 123; and “شرح تجربة العميل الرقمية,” pages 42–44 and 70 for connections between comparison, perception and experience. These are physical file-page references, not slide numbers. Source-review evidence is retained with this lesson; the original teaching slides and brand artwork are not reproduced here.
Historical attribution: Al Ries and Jack Trout's original 1972 articles, The Positioning Era Cometh. This supports the historical positioning concept, not adoption of the articles' dated claims about memory or advertising exposure. For the relationship between positioning and perceptual maps, see OpenStax, Principles of Marketing, section 5.6. The fictional cases, calculations, review process and diagrams in this lesson are original educational applications.
The lesson's source review identifies an incorrect left-hand price-axis label in introductory page 121; the corresponding strategy example on page 86 correctly indicates low price. The original illustrations here use explicitly named axes. Historical airline and fashion diagrams are not presented as current measurements. Empty space is not declared a proven opportunity, and a mean is not presented as a complete account of an audience.
Comments
No published comments yet.