
One quarter improves, but the nine-month picture is different
Nahdi Medical Company's latest results contain two stories that should be read together. In the third quarter of 2026, revenue reached SAR 2,692.0 million, up 9.4% year on year, while net profit reached SAR 171.8 million, up 6.5%. Across the nine months ended 30 September, however, revenue grew 7.0% to SAR 8,160.7 million and net profit fell 4.9% to SAR 622.7 million. The primary company release is dated 28 October; its investor-relations archive lists the materials on 29 October. This analysis does not treat either date as today's publication date.
These figures are reported in Nahdi's official earnings release. The Argaam financial-results report provides a secondary comparison. The business lesson is not that growth has stopped or that one improved quarter has resolved every pressure. Sales growth and the conversion of those sales into profit are separate questions. A useful reading keeps both visible rather than selecting whichever headline looks more favorable.
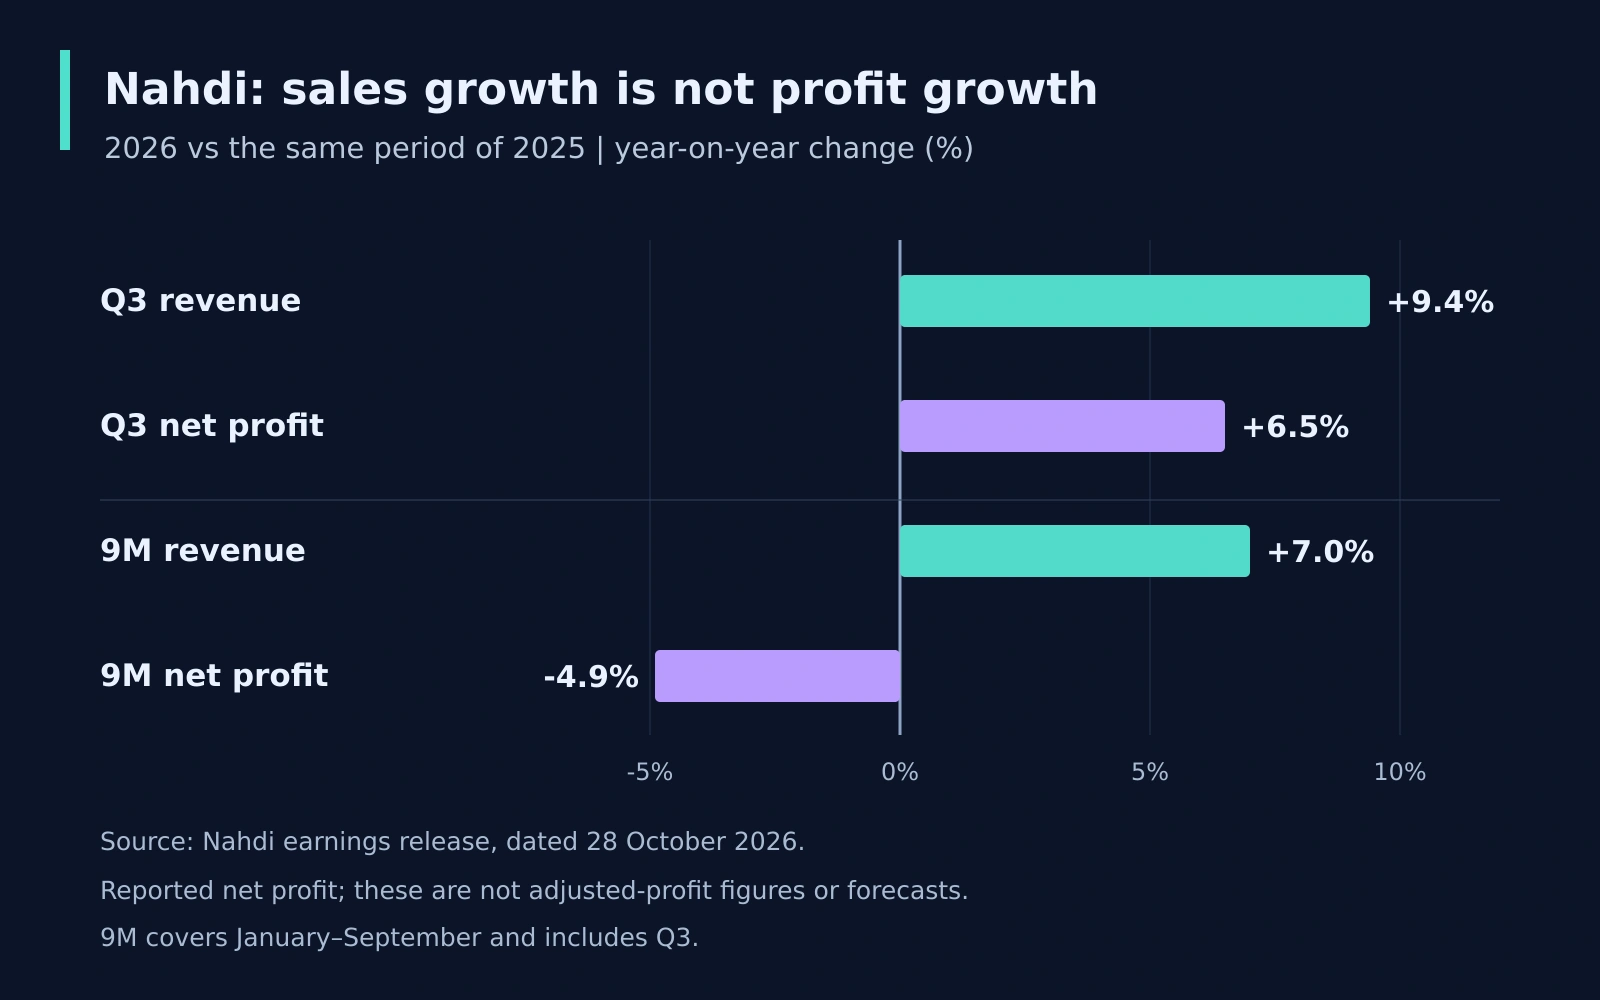
Original explanatory chart by Karim Elganainy, based on Nahdi’s official results release. The time windows are separate; growth is year on year, not a forecast.
Separate the measurement windows before interpreting performance
A quarter covers three months; the nine-month total includes that quarter and the preceding six months. An improvement in the latest quarter can coexist with a weaker cumulative result. Neither observation cancels the other. For a management team, the practical question is whether the latest movement represents a durable improvement, ordinary seasonality, a changing sales mix or a temporary comparison effect. This release alone does not answer all of those questions.
Start any dashboard with the period, unit and comparator. SAR million is not a percentage, year-on-year growth is not sequential growth, and a segment's sales growth is not the same as its profit contribution. Keep the third-quarter panel separate from the nine-month panel. A chart that places the two periods next to each other should explain that their lengths differ, rather than suggesting that their absolute values are comparable operating targets.
There is also a basic distinction between accounting profit and cash. Revenue records sales under the applicable accounting policies; net profit includes expenses and other accounting effects. Neither figure on its own tells us the cash collected from customers, investment paid for new facilities or available cash after financing obligations. Those questions require the financial statements and cash-flow detail, not a confident inference from a revenue headline.
What the margin calculation adds
Using the company's reported nine-month totals, net profit divided by revenue is approximately 7.63%. This is an author calculation: 622.7 divided by 8,160.7, multiplied by 100. For the third quarter, the same calculation produces approximately 6.38%, using 171.8 divided by 2,692.0. These are net margins for different time windows, not segment margins or a forecast of the next quarter.
The nine-month gross profit of SAR 2,952.3 million represents approximately 36.18% of revenue, calculated on the same basis. Gross profit rose 3.6%, slower than the 7.0% increase in revenue. That difference is a reason to investigate mix and economics, but it is not permission to assign an unreported amount to any single cause. A public release rarely provides enough detail to calculate the contribution of every product category, channel, promotion and operating investment.
For another healthcare retailer, the transferable discipline is to build a bridge from sales to contribution and then to operating profit. Show product costs, discounts, fulfillment, payment costs and service requirements using consistently defined data. A channel that produces more orders may still consume more resources per order. Conversely, a temporarily expensive capability might create future benefits, but those benefits should be measured rather than assumed.
The prior-year zakat item matters, without erasing the reported decline
Nahdi says the comparable prior-year period included a non-recurring SAR 17.8 million release of a zakat provision. Its release reports a 2.3% decline in net profit when that comparison effect is excluded, versus the reported 4.9% decline. Both numbers belong in the analysis, with clear labels. The adjusted comparison helps explain the base; the reported result remains the reported result.
This adjustment is not a fresh SAR 17.8 million charge in the current period, nor should it be described as an operating improvement generated this year. It changes the comparison with last year. Management also cites higher logistics costs and faster investment in strategic initiatives. Those are company explanations, not independently estimated causal shares. We should not divide the decline between logistics, technology and expansion without the necessary supporting disclosures.
An internal review can use the same discipline. First reconcile the reported result, then show each adjustment with its origin and period, then explain the remaining movement. If teams start with a preferred adjusted number and omit the bridge, readers cannot tell whether the underlying business improved or the definition changed. Comparability is a management asset, not a presentation inconvenience.
Digital growth creates a fulfillment question
The company reports that online sales accounted for 30.6% of nine-month retail revenue, compared with 25.7% a year earlier. The change is 4.9 percentage points, not 4.9% growth in online revenue. It indicates a larger channel share within retail, but does not independently establish that every digital order was incremental or more profitable than a store purchase.
That distinction matters when evaluating fast delivery and personalization. A customer might move an existing purchase from a branch to an app, add a new purchase, or choose a different basket. Those behaviors have different economics. The company's discussion of its delivery service and AI-enabled capabilities describes its operating direction; it does not provide a controlled estimate of how much either initiative caused revenue growth.
A practical management response is to connect channel reporting with fulfillment data. Track completed orders, cancellations, substitution, availability, delivery reliability, support contacts and repeat purchasing alongside contribution after variable costs. Compare equivalent markets and customer groups where possible. Do not call an attribution report a causal experiment, and do not optimize a healthcare service solely for faster conversion when suitability and accurate information remain essential.
Own brands and healthcare expansion deserve different scorecards
Nahdi reports that own-brand revenue grew 15.6% and represented 19.1% of retail revenue, up from 17.5%. That is a 1.6-percentage-point increase in share. The release also reports 32.1% growth in healthcare revenue and a network of 15 polyclinics across 10 cities. These are distinct business developments. Own-brand retail sales and clinical-service revenue should not be treated as interchangeable sources of margin.
For own brands, useful questions include repeat purchasing, returns, availability, product quality and contribution after promotions. For healthcare services, operational readiness, staffing, appropriate service demand, appointment attendance and continuity of care may matter more than basket size. A new clinic's launch period can differ from its mature operating pattern. Consolidated growth does not reveal the economics of each location or establish a medical outcome.
The broader lesson is to give each growth initiative an explicit investment case and a suitable evidence timetable. Record what must improve, how it will be measured and what would cause management to revise the plan. Avoid setting a single short-term marketing metric for businesses with different service obligations. More demand is useful only when the organization can fulfill it responsibly and economically.
An illustrative operating test for another Saudi healthcare retailer
Consider a hypothetical retailer reviewing a delivery proposition; this is a proposed method, not a Nahdi experiment or a reported company result. Begin with one service area and a defined customer need. Document current availability, delivery performance, repeat behavior and contribution. Choose one primary commercial outcome and several service guardrails before changing the customer experience.
Next test a clearer service-information page or availability message without simultaneously changing price, offer and delivery eligibility. Where feasible, use a properly designed randomized comparison. Where randomization is not feasible, disclose the observational design and competing explanations. Determine the sample and evaluation period from actual traffic, variation and the decision's economic importance, rather than declaring a universal number of days sufficient.
The review should connect demand with delivery. Did suitable completed orders rise? Did support contacts, failed deliveries or cancellations also rise? Did contribution after fulfillment improve? If marketing creates demand beyond capacity, pause scaling and fix the operating constraint. If performance remains uncertain, record that uncertainty instead of converting an encouraging early signal into a growth promise.
Karim's takeaway: make the growth engine accountable
The valuable lesson from these results is the need to evaluate expansion and profitability together. Nahdi reports growth across several activities while its cumulative net profit remains below the prior-year level. The latest quarter offers a different, improving comparison, but not a guarantee about future periods. Management's strategic intentions should be distinguished from outcomes already evidenced in the accounts.
For marketing leaders, the appropriate response is neither to dismiss growth because profit declined nor to celebrate revenue without examining cost. Build a shared scorecard with finance and operations. Make denominators explicit, distinguish percentages from percentage points, label adjustments and separate a company explanation from your own hypothesis. Then design a focused test that can change an operating decision.
This is business and marketing analysis, not a recommendation to buy, sell or hold securities. The release does not supply enough information to determine company valuation, future returns or the isolated causal impact of individual initiatives. Further conclusions should depend on the relevant financial statements, subsequent disclosures and appropriately defined operational evidence.
Comments
No published comments yet.