
Revenue growth is a starting point for evaluating a healthcare business, not a complete explanation of its economics. The results reported by Dr. Sulaiman Al Habib Medical Services Group on October 25, 2026 provide a useful opportunity to separate demand, operating performance and shareholder profit before turning financial news into a marketing decision.
The verified development
HMG’s official factsheet reports Q3 2026 revenue of SAR 4,102 million and net profit of SAR 682 million, up 18.4% and 13.2% year on year. For January–September, revenue was SAR 11,544 million and net profit SAR 1,848 million, up 15.4% and 5.6%. Amounts are rounded by the company. Both periods end September 30, 2026. Company factsheet; October 25 results coverage.
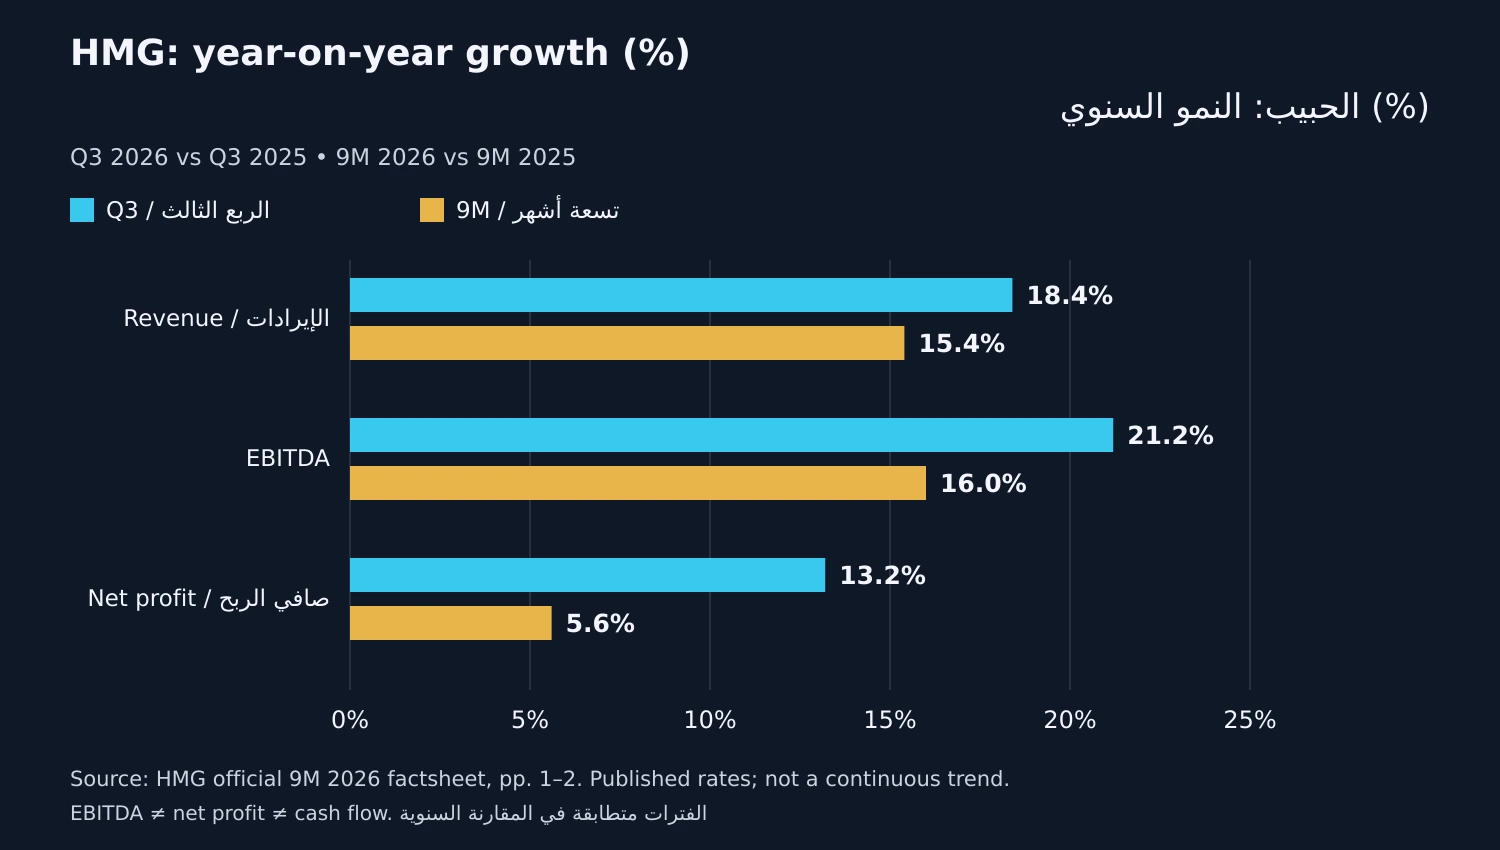
The chart compares each period with its corresponding 2025 period. It does not compare the quarter’s total with the nine-month total. EBITDA is earnings before interest, taxes, depreciation and amortisation; it is neither net profit nor cash flow. Chart source: official factsheet, pages 1–2.
Independent interpretation: do not collapse the metrics
The analysis below is an independent framework for healthcare growth teams, not a description of HMG’s internal marketing practices or an attribution of its results to advertising.
Three questions deserve separate answers. Is the organisation generating more revenue? Is operating activity covering its cost base efficiently? How much ultimately remains as net profit? A single headline cannot answer all three. A campaign dashboard that tracks inquiries without connecting them to completed care and an agreed financial definition has the same weakness: it measures one part of the journey and encourages readers to infer the rest.
The reported growth rates differ across revenue, EBITDA and net profit. That difference warrants investigation, not an invented explanation. Establishing the causes would require the relevant accounting notes and operating evidence. It would be inappropriate to assign the gap automatically to marketing cost, discounting, financing or any other individual factor. Nor can these group-level figures establish the contribution of a specific hospital, service, physician or acquisition channel.
Connect demand planning with service readiness
For a hospital considering expansion, a useful planning document combines the services it can reliably deliver with the audiences it can appropriately serve. Marketing should obtain current appointment availability, administrative eligibility rules and an escalation route before increasing demand. A hospital opening or a larger facility does not, by itself, prove that every clinic has spare appointment capacity.
Translate the plan into service-level actions. A landing page should explain the service and the next administrative step clearly. The contact centre should know what information it needs to help with scheduling and where clinical questions must go. Campaign volume should be reviewed against actual availability rather than against a lead target set in isolation.
A capacity problem is not always solved by buying more traffic. If inquiries are already arriving but appointments are not being completed, examine response delays, unclear routing and unavailable slots first. These are hypotheses to test within the organisation, not conclusions about HMG.
Use a financial bridge rather than a vanity dashboard
Create a common reporting vocabulary with finance and operations. Distinguish inquiries, eligible scheduling requests, appointments booked, attendance, completed services and recognised revenue. Keep the time window and attribution rules visible. Where finance approves a contribution measure, define which costs it includes and avoid presenting that measure as company net profit.
Review drop-offs alongside volumes. A lower cost per inquiry may hide a rise in requests that cannot be served. Conversely, a more expensive channel may produce more completed appointments within available capacity. Neither pattern should be assumed from clicks alone. Use aggregated reporting, approved access controls and the minimum necessary personal data; financial analysis does not justify unnecessary patient-level disclosure.
A practical next experiment
Choose one service with confirmed capacity and a clearly defined booking pathway. Compare two accurate explanations of that pathway while keeping eligibility, clinical review and pricing unchanged. Agree in advance how to assess scheduling completion, attendance, response time and expectation-related complaints. If feasible, use a suitable comparison group or phased rollout; otherwise report observed associations rather than claiming causation.
The decision after the experiment might be to scale the message, repair the booking journey or reduce promotion until capacity improves. The important point is that marketing and operations make that decision together. Revenue ambition should not override appropriate clinical routing or the service promise made to patients.
Strategic takeaway and limits
For healthcare marketers, the useful lesson is not to copy a listed group’s growth percentage as a campaign target. It is to connect a credible demand proposition to deliverable capacity and an agreed measurement chain. Public financial results can frame better questions, but they cannot substitute for a hospital’s own operational evidence. This article is business analysis, not personalised investment advice, a valuation or a clinical recommendation.
Comments
No published comments yet.