The McGuire Model helps you diagnose the gap between publishing a marketing message and achieving the desired behaviour. In its six-stage version, you examine Presentation, Attention, Comprehension, Yielding, Retention and then Behaviour. Its practical value is that it prompts you to ask where the message broke down, and what evidence supports that conclusion, before increasing spending or changing the design. An advertisement reaching its audience does not prove it was understood, and understanding an offer does not prove that its provider is right for the customer or that the customer can afford it.
This is a practical lesson in building a testable message, not a promise that everyone follows the same journey. We will use the model to design measurement, then apply it to a business service and an ethical health communication initiative. All figures and organisations in both examples are hypothetical teaching examples, not actual campaign results or guaranteed forecasts. The examples aim to help you distinguish a plausible explanation from a measured finding and from an assumption that still needs testing.
What does the model mean, and which version are we using?
The model treats persuasion as a set of responses that can be examined, rather than reducing success to a view or a sale. Here, we use the sequence shown in the course material: Presentation, Attention, Comprehension, Yielding, Retention, Behaviour. In this context, Yielding is best understood as acceptance of, or agreement with, the message's content, not subjugating an audience. Retention means that the meaning or attitude remains available for retrieval when needed; it does not mean retaining a customer in a subscription.
Course page 116 presents the model with an attribution to McGuire (1978). We retain this as the teaching material's reference, without presenting it as a definitive date for the idea's origin. An educational chapter published by Blackwell presents the six-stage version with a reference to McGuire (1969), explaining it from exposure through to behaviour. These differing references call for precision: we should not reduce the history of an extended research programme to a year printed beneath a diagram. Explanation of the six-stage version, figure 17.8.
This version must also be distinguished from the expanded input-output matrix. In an original chapter from 1995, McGuire explains that the level of detail can range from three responses to dozens, and uses twelve responses in his presentation. The matrix also considers the source, message, channel, audience and target behaviour. Crucially, he discusses processing shortcuts, direct connections and the possibility of reversing the sequence. We therefore use the six stages as a diagnostic lens, not a universal law. Original chapter text within the available volume, its bibliographic record.
The six stages and what to look for at each one
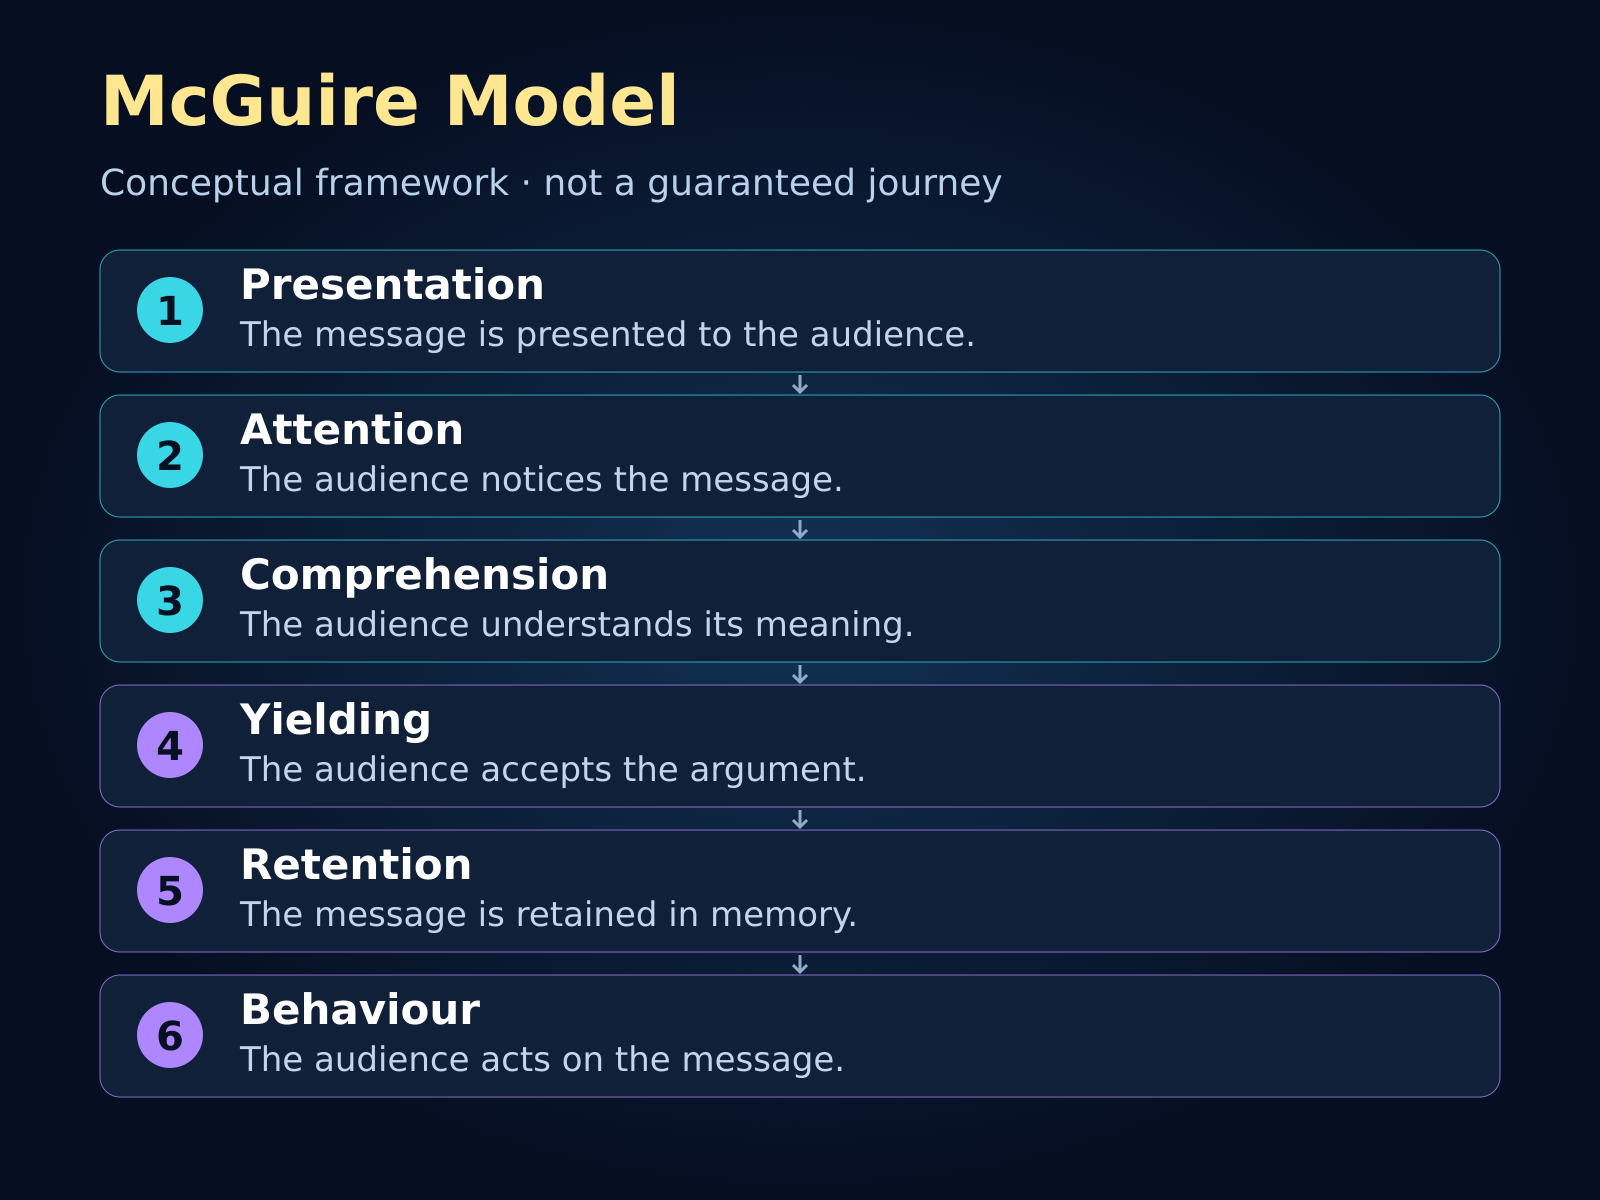
Figure caption: A diagnostic sequence of Presentation, Attention, Comprehension, Yielding, Retention and Behaviour in the six-stage version of the McGuire Model. These relationships support planning and testing; they do not guarantee a fixed path for everyone.
Presentation: Did the message reach the right person?
Start by examining the opportunity to encounter the message. You may have a published advertisement and a budget being spent, yet the person who needs the service has not seen it, or received a version in a language they do not use. Define the intended audience, channel, context and timeframe. For a business service, an advertisement might reach employees interested in the field while missing the person with purchasing authority. In that case, reach or audience definition is the problem before the strength of the argument even comes into question.
In practice, distinguish impressions from unique individuals, and the planned audience from the audience actually reached. A message technically appearing on a screen is not evidence that the screen's user consciously saw it. Record the platform's definition of the metric, the limits of deduplication and whether measurement covers every channel. You can improve the relevance of distribution, but do not record reach as acceptance or turn missing data into presumed success simply because the campaign is running.
Attention: Did the person notice the relevant idea?
Attention concerns how much interest the recipient directs towards the message. A clear opening tied to a real problem may help, while an exaggerated opening may generate views unrelated to the offer. The useful question is not simply whether people paused for the colour or movement, but whether they noticed the idea we want to discuss. If participants remember the joke but cannot identify the service, the attention-grabber's success is not equivalent to successful communication.
Choose an appropriate proxy, such as watching the section containing the main idea, then check your interpretation with a small qualitative test. Do not treat viewing time as a direct reading of someone's mind: the video may be playing while the user is occupied elsewhere. Test two ways of expressing the same benefit while keeping the other elements similar, and examine their effect on comprehension too. Improving attention at the expense of clarity can move the problem to the next stage rather than solve it, which is why you need more than one number to judge the result.
Comprehension: What did the recipient actually understand?
Comprehension is the person's ability to interpret the intended meaning correctly. In a commercial message, someone might understand that a service organises customer requests but assume it includes automated replies, when the actual offer only covers routing requests. These are not minor wording details: they affect expectations, price and decisions. Review terminology, service boundaries, prerequisites and the next step, rather than relying on a quick yes to a broad question such as whether the message is clear.
Use an open question: How would you explain this service to a colleague? Then present a situation that requires applying the meaning, such as choosing which of two different cases the offer suits. Set the scoring criteria before reading the answers, and record recurring errors. A message can be long yet understandable, or so short that it leaves people with incorrect assumptions. The goal is to remove barriers to a decision, not to cut words at any cost or add explanations the audience does not need.
Yielding: Does the idea seem persuasive and relevant?
Someone can understand a message well and reject it for a sound reason. They may not need the service, consider it too expensive, distrust the provider or already have a suitable alternative. Yielding here concerns evaluating the content; it is not the same as liking the design or being polite to the person conducting the survey. Ask about reasons for agreement and reservations, use verifiable evidence, and state important limitations rather than hiding them until the last moment.
For practical work, separate three questions: Does the recipient believe the claim, see its benefit and consider it suitable for their circumstances? The answers may differ. Do not classify every rejection as a defect to eliminate; screening out poor fits protects the quality of the relationship later. When acceptance is weak, examine the truthfulness of the promise and the quality of the offer before polishing a testimonial or increasing message frequency. The model does not justify persuading someone to act against their own interests.
Retention: Can the person retrieve the meaning when needed?
Someone may like an offer today but not make a decision until a week later. Examine what remains in their memory, whether they attribute the idea to the correct source and whether crucial details are still clear. Remembering the brand name alone may not be enough, especially when the terms differ from expectations. Conversely, a habitual buyer may not need to remember a particular advertisement to choose a product they know from previous experience.
Design a useful retrieval aid, such as a saveable summary, a simple comparison or a link back to the offer's details. Test retention after an interval appropriate to the decision, and distinguish unaided recall from recognition after presenting options. Marketing reminders require respect for communication consent and the option to opt out. Excessive repetition can annoy the audience and reduce trust, so monitor complaints alongside return visits to the page, and do not substitute a sequence of messages for a clear meaning.
Behaviour: Did the specified action happen?
Choose an observable behaviour that matches the task's objective. Requesting a demonstration is not a contract, booking an appointment is not attendance, and opening the payment page is not a completed purchase. The team must name the same action when building the report so that it does not compare different things. Also check whether the system records the event once, and how it handles cancellations, test requests, internal visits and technical errors.
If acceptance is strong but behaviour is weak, examine ease of execution, ability and opportunity. Payment may be unavailable, there may be no appointments, or the decision may require another party's approval. A more enthusiastic headline cannot solve these barriers. Nor does behaviour occurring after an advertisement prove that the advertisement caused it: the person may already have intended to act. Gather evidence about the path, and use an appropriate comparison when estimating the campaign's incremental effect.
When is the model useful, and when do you need other tools?
The model helps when the team's metrics differ and interpretations conflict. The advertising lead may report high engagement, the sales lead may find the enquiries unsuitable, and customers may say they did not understand the terms. Breaking the problem into questions helps each party identify the claim they can support and the evidence they lack. It is also useful before launch, because you can uncover a gap between the advertisement's promise, the page's content and how the service is delivered before spending money.
If the problem concerns product quality, pricing or operational capacity, however, fixing communication alone has limited value. You then need market research, a review of the service experience, and analysis of the offer and its alternatives. For repeated decisions, habit and availability may matter more than remembering the message. Organisational decisions involve several people with different interests; it is not reasonable to compress them into one person moving smoothly through the stages. Choose the tool to fit the question rather than forcing reality into the diagram.
There is also a distinction between a plan for creating a campaign and the audience's response path. In his original summary of persuasion applications, McGuire presents campaign-development procedures and a matrix for constructing communication; not every list bearing his name is the same six-stage sequence. In your document, separate what the team does from what you are trying to measure in the audience, so that internal approval or media buying is not presented as a psychological response in the customer. The author's account of developing persuasion campaigns.
A practical, step-by-step application
Start with one decision and one audience within a clear timeframe. Instead of saying we want to increase awareness, write that business owners facing a specific problem should be able to explain the solution and request an appropriate trial during the study period. Also define what the campaign does not aim to do, such as selling a service to someone who does not need it. This makes choosing metrics simpler and prevents any digital activity from being turned into evidence that the objective has been achieved.
Next, map a hypothetical decision path and write a question, a metric and its limitations beside each stage. You may have technical logs for reach, an interview sample for comprehension, a survey for acceptance and operational records for behaviour. Do not pretend that these data are equally precise or concern the same people. Clearly mark the connections you have not verified, then decide whether they need further study before being used in a financial conclusion.
Review the message with people who resemble the target audience, not just the team that knows the product inside out. Ask them to explain the promise, describe the next step and identify missing information. Look for patterns in the responses rather than focusing on one striking remark. When views conflict, examine differences in context or need. You may need two messages for two audiences instead of seeking a single text that satisfies everyone and explains everything.
Turn the diagnosis into a specific hypothesis: clarifying the service's boundaries will reduce misunderstanding, or showing available appointments will reduce booking difficulties. Choose a change you can connect to the proposed cause, and set the decision criterion in advance. Avoid changing the headline, price, audience and booking page simultaneously and then attributing the result to one factor. If you must introduce a package of operational changes, describe the result as the package's effect rather than claiming to isolate its components.
Finally, set a rule for continuing, stopping and documenting what you learned. If comprehension improves and demand from unsuitable customers increases, review targeting rather than simply celebrating. If complaints decline while requests remain stable, there may be value that the conversion rate does not show. Write the definitions, measurement timing and limitations alongside the result, so that someone else can understand the decision without relying on the team's memory or the enthusiasm of a presentation.
Hypothetical business example: A service for organising customer requests
Suppose a company offers a service that organises customer requests for small businesses. The campaign's objective is a qualified trial request, not immediately signing a paid contract. In this teaching exercise, imagine one group of 10000 people and track nested responses within it without losing data. This is a simplifying assumption for calculation, not a description of what advertising platforms usually provide. We also assume that reach, attention, comprehension, acceptance, retention and requests are defined before data collection.
Within the target group, the offer reaches 8000 people, 4000 pay attention, 2400 understand the intended meaning, 1200 accept it, 900 retrieve the meaning at decision time and 180 request the trial. The conditional transition rates are 80%, then 50%, then 60%, then 50%, then 75%, then 20%. The word conditional matters: the last rate describes 180 out of 900, not requests as a share of the entire target audience. The overall result is 180 ÷ 10000 = 1.8%.
To check the arithmetic, the product of 0.80 × 0.50 × 0.60 × 0.50 × 0.75 × 0.20 is 0.018. Multiplying conditional probabilities does not assume that the stages are independent; it requires correctly defined conditions and a nested group that can be tracked. If you take the comprehension rate from selected interviews and the acceptance rate from different visitors, you cannot combine them this way as though they were transition probabilities along the same path. Present them as separate indicators instead, and state the limits of comparison.
A low final conversion rate might appear to indicate a weak sales team, but a review reveals that the trial button leads to a long form requesting information that is unnecessary to begin the trial. The proposed hypothesis is to reduce the burden and explain why each piece of information is needed, while keeping the minimum required to check customer fit. We are not declaring that this change worked; we are proposing a test comparing two versions with appropriate allocation and monitoring request quality and privacy alongside volume.
In a hypothetical sensitivity scenario, if only the final rate rises from 20% to 30% and everything before it stays constant, requests become 900 × 0.30 = 270, an increase of 90 requests or 50% relative to 180. The overall rate rises to 2.7%, an increase of 0.9 percentage points. These figures illustrate an assumption; they are not a forecast. Request quality or the team's capacity to serve those customers may change, so we do not automatically equate more requests with more profit.
Hypothetical health example: Clarifying an educational session's appointment details
Suppose a health centre offers a general educational session for adults, and the communication aims to support attendance by people who chose to register after understanding the session's content. We are not promoting treatment, diagnosing a condition or promising a health outcome. An appropriate professional reviews the content before use, and the local organisation's rules and communication consents are respected. The message explains the session's topic, duration, nature and limitations, as well as how to ask questions or withdraw; it does not use fear or embarrassment to increase response.
In a hypothetical group of 2000 people who agreed to receive this type of information, the message reaches 1600, 1200 pay attention, 900 understand, 600 accept the idea of attending, 450 remember the relevant details when planning and 180 attend. The transition rates are 80%, then 75%, then 75%, then approximately 66.67%, then 75%, then 40%. The final rate is 180 ÷ 2000 = 9%. In multiplication, we use the exact fraction 600 ÷ 900 rather than the rounded value to avoid rounding error.
The full calculation is 2000 × 0.80 × 0.75 × 0.75 × (600 ÷ 900) × 0.75 × 0.40 = 180. This result does not mean that 9% experienced better health, or that everyone else rejected education. Work schedules may conflict, transport may be unavailable, or someone may prefer written material. We therefore record reasons for non-attendance voluntarily and with the minimum necessary data, and offer a suitable alternative where the service allows, rather than assuming a lack of awareness or responsibility.
Hypothetical interviews reveal that some participants understood the session time but could not easily find its location. One possible test is a reminder they have consented to receive, containing clear directions and a simple cancellation option. For calculation purposes, assume this increases attendance among those who remembered from 40% to 50%, with all other counts held constant. Attendance becomes 450 × 0.50 = 225, an increase of 45 and an overall rate of 11.25%. The difference is 2.25 percentage points, and the relative increase is 25%.
Ethical evaluation does not end with this hypothetical improvement. Monitor information clarity, respect for refusal, accessibility and whether notifications disclose sensitive details. Do not send health data to advertising tools to improve targeting, or make access to care conditional on marketing consent. Successful communication here means helping people make an informed decision and carry out their choice easily; deciding not to attend after understanding the content may be right for them and must be respected.
How can you read the numbers without being misled?
Every report contains three distinct levels: the event count, its rate relative to a specified denominator, and the effect caused by the intervention. Moving from one level to another requires additional evidence. Requests can increase because the audience expands even as the rate declines, or the rate can improve because you narrowed the audience to people closer to purchasing. Write the denominator, period and event definition beside every rate, then compare versions that are as similar as possible.
The smallest rate is not always the best place to invest, either. Raising it may be costly, impossible or ethically undesirable. Compare the size of the opportunity, the cost and risk of the change, and its expected effect on outcome quality. Improving the explanation of terms may matter more than increasing clicks because it reduces unsuitable requests and later cancellations. Do not reduce value to the last box in the diagram if that conceals a poor experience or misleading expectations.
Building a measurement card the team can use
To put the explanation into practice, create a short card for each metric rather than merely listing its name on a dashboard. Write the question it answers, its collection method, the denominator used, the period it covers and who reviews its quality. If the metric is an estimate from a sample, say so explicitly. If you cannot deduplicate a person's phone and computer, do not label the count as unique individuals with absolute confidence. Making these details clear saves lengthy discussions when advertising figures differ from the sales system's figures, because the difference may come from definitions and timing rather than either team's mistake.
Also mark the boundary between observation and interpretation on the card. The statement that participants closed the page after reaching the pricing section is a behavioural observation if tracking is correct. The statement that they rejected the price because it was too high is an interpretation requiring a further question or experiment. The section might be slow, the information they needed might be complete, or the price might be suitable but the purchase still far off. Writing two plausible alternatives for each important interpretation helps you choose the next test and reduces the tendency to change the price or message in response to the first story that sounds logical.
It is also useful to specify what you do not want to collect. Testing comprehension of a commercial offer does not require medical history or family details, and checking whether someone remembers an appointment does not require storing all their conversations. Collect enough data to answer the question, and define access rights and retention periods according to the rules that apply to the organisation. When presenting results to the team, prefer summaries that do not reveal identities unless there is a legitimate need and appropriate consent. Respect for privacy is not a decorative addition to measurement; it is a fundamental constraint on its design, interpretation and use.
Reviewing the message through the recipient's experience
Try reading the advertisement, page and request form in the order a new visitor encounters them. Look for words whose meaning changes across locations, terms revealed late and promises for which the reader cannot find evidence. If the advertisement describes a simple trial while the form requires a long-term commitment, the expectation gap may matter more than any attention problem. Record this inconsistency as an issue requiring a fix to the offer or its delivery, rather than trying to compensate with a more attractive image or an unjustified urgency claim.
Then repeat the review in a different usage context: a small screen, a slow connection or a reader who prefers another language. This is a suggested practical review, not additional stages of the model. The aim is to ensure that the content arrives in a readable form, the next step is understandable and alternatives are available when difficulties arise. Do not assume that translating words alone conveys the meaning; usage examples and terms may require context-appropriate explanation while preserving the truth of the offer and avoiding invented local features that the product does not provide.
Set aside meeting time for findings that contradict your expectations. If reading time increases but comprehension declines, examine the text's difficulty rather than declaring improved interest. If requests fall but their fit improves, discuss operational capacity and actual returns before judging the campaign a failure. The model helps when it enables you to ask a more precise question, but loses value if it becomes six boxes that must all be coloured green. Keep a record of changes and the reason for each decision so that the team does not test the same hypothesis again weeks later without remembering what it learned.
Practical exercise: From diagnosis to a defensible decision
Choose one message from your project and describe the behaviour you want it to produce in a verifiable sentence. Then write six questions covering the stages, identifying available and missing evidence for each question. Ask a colleague unfamiliar with the project to explain the offer back to you, and record where their interpretation differs from your intention. Do not fix the text immediately; first try to understand the source of the confusion, which may lie in the offer itself or in the prior knowledge it requires.
For arithmetic practice, use a hypothetical group of 1000 people: the offer reaches 800, 400 pay attention, 300 understand, 150 accept, 120 remember and 24 act. Calculate the overall result and the final rate, then assume the final rate rises to 30% while all other values stay constant. Before giving the result, state the assumption that the groups are nested; afterwards, provide an alternative explanation unrelated to persuasive strength. The aim is to be able to scrutinise your conclusion, not merely produce an attractive number.
The arithmetic answer is 24 ÷ 1000 = 2.4%, and the final rate is 24 ÷ 120 = 20%. In the revised scenario, the count becomes 36 and the overall rate 3.6%, an increase of 12 or 50% in relative terms, and 1.2 percentage points overall. The hypothetical cause might be fixing a fault in the form rather than improving the audience's attitude. Finish the exercise with one test, a quality metric and a stopping rule, then state what you will not be able to conclude from that test.
Limitations and practical conclusions
The stages are interpretive states, while many of our tools record only approximate digital behaviour. We cannot read comprehension from scrolling or agreement from clicking. Surveys themselves may change attention or aid recall, and people who drop out may differ from those who complete them. Record participant attrition, sample caveats and question wording, and do not present high numerical precision as though it repairs weaknesses in the original measurement.
Use the model to guide discussions among marketing, product, service and research teams while leaving room to discover other paths. The service experience may feed back and change acceptance, knowledge may come from a colleague before the advertisement, and behaviour may occur through habit. Your best plan allows these possibilities to emerge and revises its interpretation when new information arrives, rather than defending a fixed sequence because the design looks convincing on screen.
Before launching your next message, make sure you have clear answers to four questions: who needs it, what they should understand, what will help them evaluate it fairly and what will help them carry out their choice. Then choose a measurement that tests your weakest important assumption. In this way, the McGuire Model becomes a tool for improving decision-making and communication, while respect for the recipient's judgement, freedom and the limits of evidence remains part of success itself.
For comparison with other response frameworks, see the AIDA guide to interest and action and the Lavidge–Steiner hierarchy-of-effects guide. These linked background editions are in Arabic. Differences in labels and stages do not make any model a universal law for every decision.
Sources and attribution
- Original course material, page 116, lecture 4, slide 5/21: the six-stage sequence and the reference to McGuire (1978). We visually reviewed the page; the diagram published for this lesson is original, not a copy of the slide.
- Blackwell: Chapter 17, figure 17.8, book page 368: a secondary educational source confirming the stage names, with a reference to McGuire (1969).
- McGuire, 1995: Transferring Research Findings on Persuasion to Improve Drug Abuse Prevention Programs, NIDA Research Monograph 155, pages 225–245. Original text within the volume uploaded by one of its authors: particularly pages 229–235 on the matrix and limitations of response ordering. The hosting page's title refers to Richard E. Petty's chapter, but the attached file contains the complete volume and McGuire's chapter; we do not attribute Petty's chapter to McGuire.
- McGuire, Developing Effective Persuasion Campaigns, in Constructing Social Psychology, 1999 edition, pages 136–179: we reviewed the original summary available from the publisher, not the full restricted-access chapter.
- Theoretical Foundations of Campaigns record, 1981 edition: describes a matrix with five input categories and twelve responses. The record is a bibliographic description, not access to the full text, and is not used to establish the model's earliest date.
The examples, calculations and review steps in this lesson are an original educational treatment. They are neither empirical findings from the sources nor treatment recommendations, and they do not establish that every transition in the diagram is necessary for every person or decision.
Comments
No published comments yet.