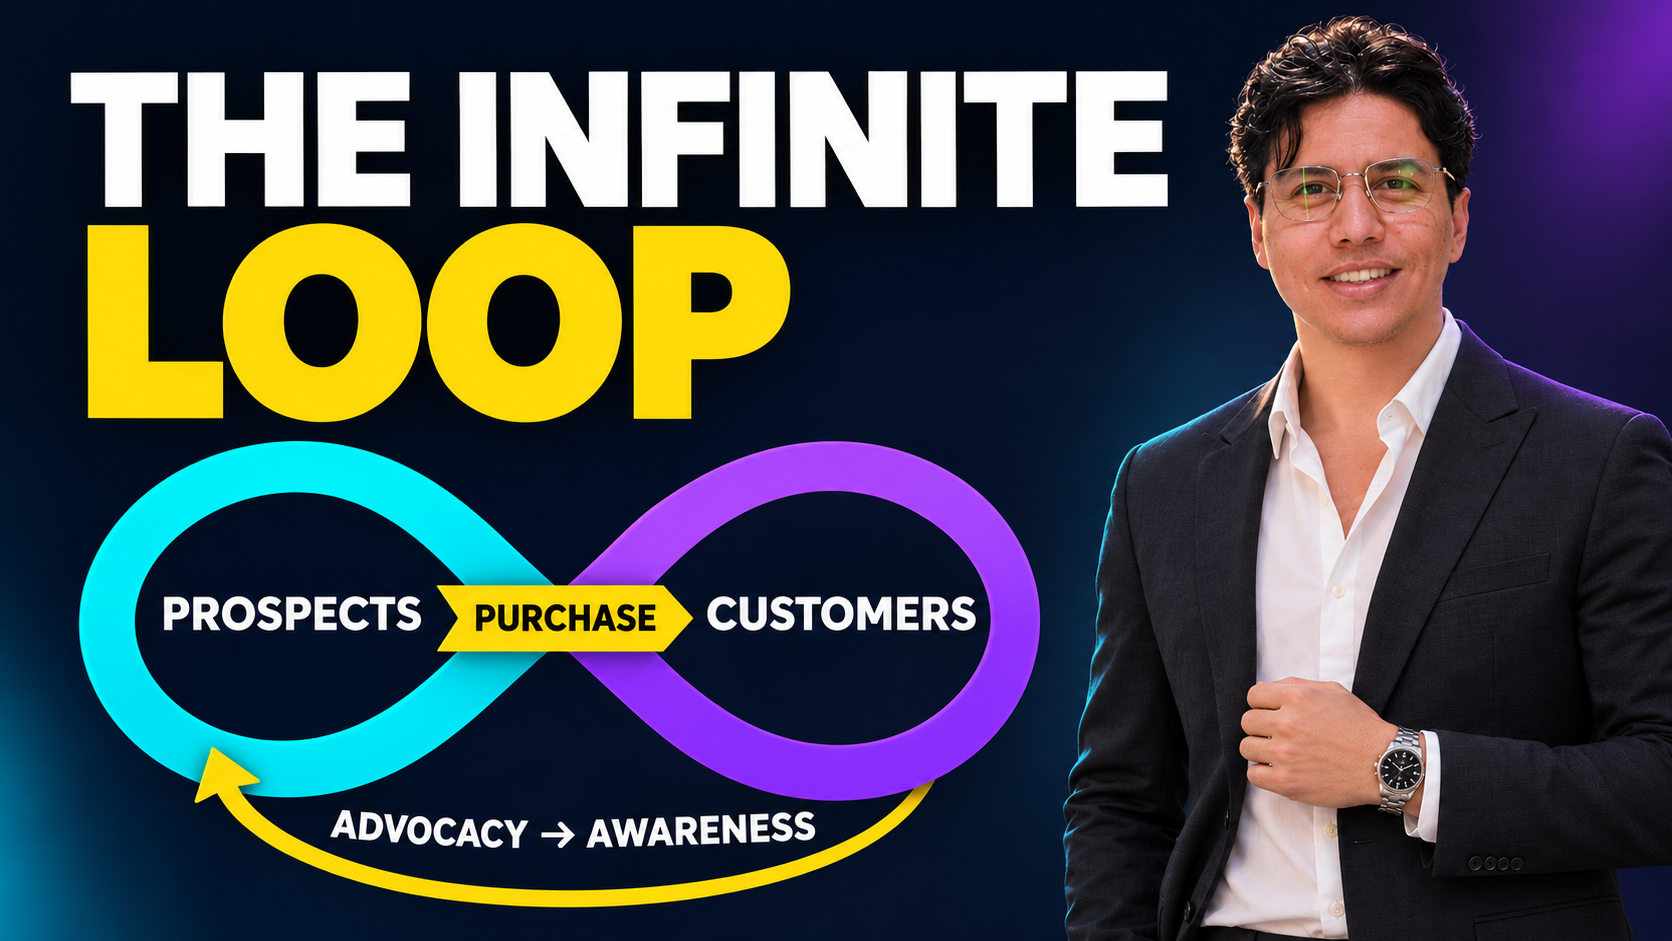
What is the infinite loop, and what decision does it help you make?
The infinite loop is a customer-journey planning model that connects customer acquisition with what happens after purchase. Instead of ending the map at the signed contract, it places purchase in the middle and follows onboarding, adoption, expansion, retention and advocacy. It then asks how existing customers’ experiences help create new awareness. Its practical value in business-to-business work is that marketing cannot fulfill its promise alone: sales sets expectations, delivery makes them achievable, and customer success reveals whether value has actually been realized. We therefore use the diagram not to decorate a presentation, but to identify each team’s responsibility and the evidence required before moving an account into a new state.
The basic idea is simple: initial revenue does not equal a successful relationship, renewing a contract does not necessarily mean loyalty, and a satisfied customer is not obliged to refer others. Every transition needs verifiable conditions. An account might move back from comparison to research, stop after onboarding, or expand usage before renewal. The loop is an organizing tool, not a law imposing the same sequence on every buyer. In this lesson, we turn it into an operating map, using two hypothetical examples and calculations that can be checked, without presenting the figures as actual results or general market benchmarks.
The source and the limits of our attribution
The arrangement of the model’s components is based on physical page 153 of the Introduction to Marketing file supplied in the course materials, in the customer-journey lecture. That page shows the prospect side, a central purchase point, and the existing-customer side, with advocacy feeding awareness. Both the text and the image were examined, because a stage name alone does not explain its position or relationship to other stages. The slide references the Email on Acid article on customer journey map examples, published on 18 February 2021. We cite it for documentation, without inferring the model’s inventor or date of origin from its inclusion.
The measurement definitions, team-handoff rules, calculations, implementation plan and exercise below are original educational proposals for applying the model. They are not mandatory steps copied from the slide, nor a description of a program used by an actual client. For comparison with an approach focused on conversion stages before the sale, see the linear marketing funnel lesson in Arabic. Neither approach cancels out the other: the funnel can measure a defined opportunity cohort, while the loop helps explain what changes after those opportunities become paying accounts.
Reading the diagram without turning it into a compulsory route
On the prospect side, we find brand awareness, awareness of need, research, consideration and comparison. Purchase sits at the central connection. On the customer side are education and onboarding, followed by adoption, upselling and cross-selling, retention and loyalty, then advocacy that feeds awareness again. These are the elements of the diagram as used here. Their appearance on a connected illustration does not mean that the budget holder, user and technology manager move through them simultaneously, or that advocacy begins only after years of working together.
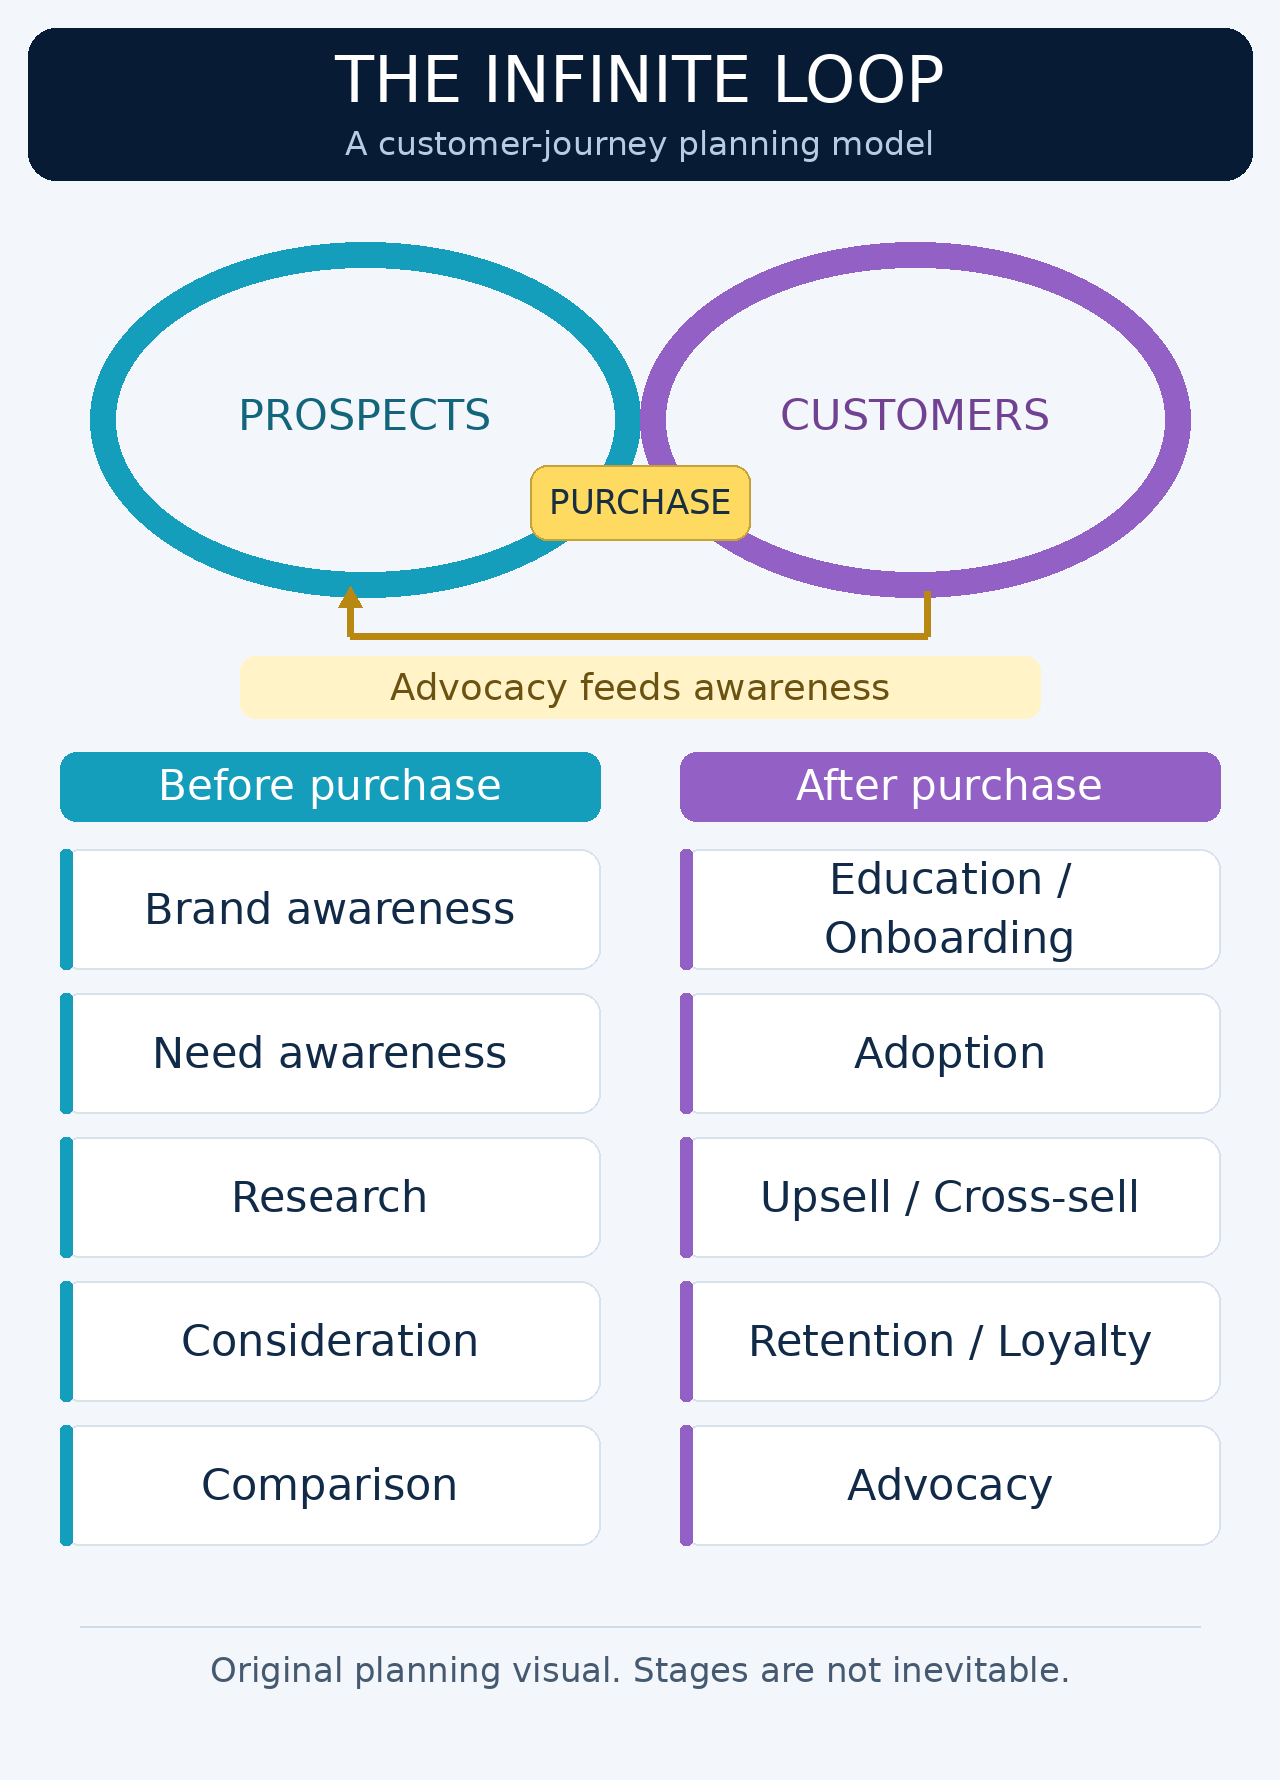
Original educational diagram based on page 153 of the course material: purchase connects the two sides of the relationship, and advocacy feeds awareness. The connections support planning; they do not prove an inevitable sequence for every account.
Read the diagram as a set of connected questions. What makes an organization aware of us? What problem is it trying to solve? What evidence reduces decision risk? After contracting, who will use the solution, and how will we know it works? Two different answers may coexist within the same account: procurement is comparing prices while operations still needs to understand the problem itself. We therefore keep both an account map and a stakeholder map, rather than compressing their differences into a convenient statement such as “the customer is at the comparison stage.”
Brand awareness and awareness of need are not the same
A company manager may know a software provider’s name without seeing a reason to change the current way of working. Another may recognize a problem with delayed reports without knowing a suitable provider. In the first case, the knowledge gap concerns the need and its priority; in the second, it concerns the available options and confidence in them. Treating the situations identically means sending a premature commercial proposal to someone who sees no problem, or repeating general content to someone already seeking a specific solution.
Start by recording a modest behavioral signal for each situation. Reading an explanation of a problem may indicate interest, but it is not an admission that a budget exists. Requesting a comparison between two alternatives is a stronger research signal, but does not establish purchasing authority. In the proposed application, add an open question to the conversation: what happened that made this topic important now? The answer helps distinguish personal curiosity from an organizational project and avoids turning every marketing interaction into an optimistic sales opportunity. The goal is not surveillance, but collecting the minimum necessary business information with consent and a clear context.
Research, consideration and comparison: three kinds of uncertainty
During research, the team explores possible categories of solution, including continuing with the current approach or developing an internal solution. During consideration, it asks whether a solution fits its constraints: does it have the implementation time, budget and skills required? During comparison, it weighs specific alternatives against shared criteria. Separating these questions is useful because content explaining a new category cannot replace an implementation plan, and a pricing table cannot resolve uncertainty about responsibility for integration.
An account decision log can record the problem, alternatives, selection criteria, constraints and unresolved questions. The criteria should be understandable to both sides: implementation time, coverage of required use cases, total operating cost, and the team’s ability to rely on the solution. Do not assign a numerical weight to every criterion simply to create an illusion of precision. If decision makers have not agreed on priorities, the next task is a clarification session, not a more complex scoring table. Likewise, do not assume the cheapest competitor caused a loss before asking about fit, timing and risk.
Purchase at the center: handing over a promise, not ending the work
Placing purchase in the middle changes the meaning of the deal-closing meeting. Instead of receiving only the contract value and start date, the delivery team needs to understand the promise on which the decision depended. What outcome is required? What is included in scope, and what is excluded? Who prepares the data, and who approves the outputs? What conditions could prevent value from being achieved? If this information remains in the salesperson’s private messages, the customer will enter onboarding only to explain the entire story again.
Create a short handoff document agreed by sales, delivery and the customer. Include the first use case, decision maker, operational owner, prerequisites, initial success indicator and a realistic review date. Do not treat contract signature as proof that the document is complete. An account can be paying but not operationally ready because data is missing or no internal owner has been appointed. Recognizing that state does not diminish the sales achievement. It prevents delay from becoming a surprise and makes the promise testable instead of leaving it as a generic statement about improving efficiency.
Education and onboarding: design first value, not the largest training library
Education explains what can be done; onboarding removes the obstacles to doing it in the customer’s context. Watching a training course cannot replace correct permissions or approval of suitable data. Start by choosing a narrow use case with understandable value, such as producing the first approved report or completing the first documented maintenance order. Then identify what reaching it requires, postponing features that do not serve that purpose so that getting started does not become a test of the customer’s tolerance for complexity.
Time to first value can be measured from the date prerequisites become available, while also retaining total elapsed time from contracting. Showing only the first number may hide a lengthy requirements-gathering delay; showing only the second may make delivery accountable for waiting outside its control. Record the cause of the blockage, the party able to resolve it, and the next step. Give a new user a clear route to help. Onboarding quality is not demonstrated by the number of welcome messages, but by the customer’s ability to complete an important task correctly with effort that can be sustained.
Adoption and expansion: do not confuse activity with value
Adoption means incorporating the solution into work, not merely logging in. For inventory software, the important event might be closing an approved stocktaking cycle; for a consulting service, it might be implementing and reviewing an operational decision. Choose a definition connected to the promise sold, and specify the unit of measurement: account, team, location or eligible user. The number of adopting accounts is not the percentage of active employees, even if the two figures look similar on a dashboard.
Once basic usage has delivered value, upselling or cross-selling may be considered where a suitable need exists. Upselling expands the current solution’s level, while cross-selling adds a complementary solution. Offering expansion to an account whose initial experience has failed, however, can compound a trust problem. Make eligibility explicit: demonstrated core value, an understood additional need and available delivery capacity. The best temporary commercial decision may be to refuse expansion until the service stabilizes. This is not a stage into which every customer must be pushed, but an opportunity requiring fit and separate agreement.
Retention and advocacy: different relationships to each
Retention tells us that a relationship continued over a defined window, but not why. A customer may renew because of value, because switching is costly, or because the contract has not yet reached its review date. Distinguish countable contractual continuity from loyalty, which needs broader evidence. Compare contracts genuinely due for renewal instead of putting new customers into the denominator and making performance appear better than it is.
Advocacy is an additional behavior, such as making a suitable referral or permitting a documented case study. Do not turn an internal satisfaction request into permission to publish, or use a customer’s name and results outside the scope of consent. When a referral arrives, retain its declared source alongside the other touchpoints without definitively attributing every subsequent effect to it. The customer’s voice can then feed awareness without claiming that every good experience generates new sales. The loop creates room for learning; it does not guarantee self-sustaining growth or remove the need for direct acquisition.
First hypothetical example: inventory software for distributors
Suppose a company supplies inventory management software to distributors and follows one cohort of 200 organizations that expressed interest connected to a specific problem during a quarter. After verification, 120 agreed to discuss solution requirements, 60 requested a proposal tied to a clear use case, and 24 signed a contract. These are hypothetical educational figures, not data from a real company. Nor does the cohort include everyone who saw an advertisement: beginning with documented interest prevents a claim that we measured conversion from general awareness, which we cannot fully observe.
The transition to a requirements discussion is 120 ÷ 200 × 100 = 60%. Proposal requests among organizations that discussed requirements are 60 ÷ 120 × 100 = 50%. Purchases among those requesting proposals are 24 ÷ 60 × 100 = 40%. Overall conversion from the initial cohort to purchase is 24 ÷ 200 × 100 = 12%. These are four different indicators: 40% cannot be described as conversion of everyone interested. Knowing the denominator protects decisions from comparing an attractive number with another number that answers a different question.
Delivery received the twenty-four accounts. Within 45 days, 18 completed data and permission setup, and 15 achieved their first approved stocktaking cycle. Onboarding completion among buyers is therefore 18 ÷ 24 × 100 = 75%. First-use achievement among onboarded accounts is 15 ÷ 18 × 100 = approximately 83.33%, while its rate among all buyers is 15 ÷ 24 × 100 = 62.5%. The distinction matters: better performance within the onboarded group does not resolve the six accounts that never completed onboarding in the first place.
In this hypothetical scenario, the team reviewed the blockages and found four accounts waiting for item-data cleansing and two without an appointed internal owner. The proposed decision is not to increase reminder messages for everyone, but to add a readiness check before contracting, a clearly scoped data-assistance service, and confirmation of the owner at handoff. Do not attribute later results to this change before testing it: we have a diagnosis and plan, not causal proof. An operational trial can begin with the next cohort, keeping event definitions fixed and disclosing differences in customer size and complexity.
At year-end, all twenty-four contracts became due for renewal, and 20 renewed. Account retention is 20 ÷ 24 × 100 = approximately 83.33%. Six of the renewed accounts supplied qualified referrals, making the referring-account rate within that group 6 ÷ 20 × 100 = 30%. Because some accounts supplied more than one referral, eight referred organizations arrived, and two purchased: referred-organization conversion is 2 ÷ 8 × 100 = 25%. Do not equate six referrers with eight referrals, or add the two new organizations to the original cohort’s renewal denominator.
Second hypothetical example: preventive maintenance for factories
The second example moves from employee-operated software to an operational service contract. A preventive-maintenance provider serves factories whose buyers care about operational stability, team responsiveness and clear reporting. Suppose 80 factories agree to an initial assessment; 40 fit the service scope and available schedule; 30 then request a detailed proposal; and 12 sign. Every number below is hypothetical and does not describe an actual provider’s performance. The counting unit is the contracted factory, not visits or the number of machines inside it.
Initial fit is 40 ÷ 80 × 100 = 50%. Proposal requests among suitable factories are 30 ÷ 40 × 100 = 75%. The win rate among proposals is 12 ÷ 30 × 100 = 40%. Conversion from the initial-assessment cohort to a contract is 12 ÷ 80 × 100 = 15%. The win rate can match the software example while onboarding differs fundamentally. Transferring a dashboard between businesses with only the product names changed is therefore insufficient.
All twelve factories completed safe-access requirements and visit scheduling, and ten completed their first accepted maintenance review within the agreed window. Achievement of this event is 10 ÷ 12 × 100 = approximately 83.33%. Two factories were delayed because an equipment shutdown slot was unavailable, not because technicians failed to carry out a confirmed visit. Accurate recording preserves that distinction. Here, adoption is defined as closing follow-up actions resulting from the review, rather than the number of times a report is opened. Eight of the ten factories closed their required actions, giving 8 ÷ 10 × 100 = 80%.
The cohort’s annual contracted value at the start was SAR 120,000, or SAR 10,000 per factory. At renewal, ten factories renewed, giving base revenue of SAR 100,000. One then reduced service scope by SAR 5,000, while three added suitable services totaling SAR 15,000. Retained recurring revenue before expansion becomes SAR 95,000, and after expansion SAR 110,000. Gross revenue retention is 95,000 ÷ 120,000 × 100 = approximately 79.17%; net revenue retention is 110,000 ÷ 120,000 × 100 = approximately 91.67%. These are contracted values before taxes and costs, not profit or collected cash flow.
Retention by factory count is 10 ÷ 12 × 100 = approximately 83.33%, distinct from both revenue rates. Expansion also does not mean the loop is healthy: the cohort lost two factories and a third reduced its scope. Management should review the reasons for departure and contraction, then check that the team can deliver added services without damaging its original commitments. For advocacy, three factories agreed to share a documented experience after reviewing it. This is specific publication consent, not three new deals. Do not record a referred enquiry before it actually arrives, or claim a marketing effect merely because a case study was produced.
Building a measurement dictionary that preserves meaning
Before designing a dashboard, define every event, denominator, time window and recording source. “Active customer” is not enough: specify the qualifying activity, how often it occurs, and who belongs in the measurement cohort. Two dates may be necessary: when the event happened and when it entered the system, so that delayed entry does not create an imaginary decline in performance. Retain unknown states too, rather than turning missing information into assumed success or failure.
Monitor three levels together: account transitions, value achievement and operating quality. The first reveals where journeys stop; the second asks whether customers achieved what they bought the solution for; the third shows the cost and stability of delivery. Adoption can rise while support hours balloon, or renewal can improve through discounts that destroy viability. The model does not automatically resolve these trade-offs, but it makes teams see them in the same meeting. Choose a small number of indicators linked to actual decisions and leave metrics with no clear associated action outside the main report.
A practical six-week implementation plan
In week one, choose one segment and one use case, and assemble a small team from marketing, sales, delivery and customer success. Review a limited number of successful and stalled accounts, then map the actual route rather than the desired one. In week two, agree on stage definitions and who updates them, and identify the information that must be handed over at purchase. Do not begin by rebuilding every system: a limited, structured record may reveal the problem faster than a large technology project.
During weeks three and four, test one handoff, such as the move from contract to onboarding, specifying in advance what will change and what will be measured. In week five, review exceptions and recording quality, and ask employees whether the new rule helps or adds work without value. In week six, decide whether to continue, revise or stop. This is a proposed operational learning period, not a promise of revenue improvement within it: an annual renewal cycle means six weeks cannot prove a retention effect. Share the learning internally, including data limitations, before extending it to other segments.
Accountability rules that stop accounts falling between teams
Assign every transition an owner responsible for completion, a receiving party, and a clear acceptance condition. A salesperson marking an opportunity “closed” is insufficient if delivery cannot identify the promised use case. Conversely, delivery should not reject an account without describing the missing information and the step needed to complete it. Make exceptions visible and give them a review date, rather than leaving a field open indefinitely. This reduces arguments about who caused the problem and returns the discussion to what the customer needs now.
Connect incentives with some degree of handoff quality, but avoid holding individuals accountable for outcomes they cannot influence. For example, review the completeness of contract information and whether the promise matches scope, rather than tying a salesperson’s commission to every subsequent change in customer usage. Keep an escalation route for unrealistic promises before they become disputes. The loop does not justify collecting all personal data in one place: set appropriate permissions, retain only what serves the relationship, and separate consent to provide customer service from consent to use the customer’s story in marketing.
When is the model useful, and when is it excessive?
The model helps when the offer’s value depends on delivery, learning or extended use, and when existing customers’ experiences can influence later opportunities. It also shows how retention problems may begin with targeting or a promise made before the sale. However, it may be unnecessarily heavy for a simple recurring transaction with no meaningful onboarding requirement; in that case, retain the general logic while reducing operational states. A seasonal business or one-off project should not be forced to have annual renewal merely because the model includes retention.
Advocacy may also be unpublishable for contractual or competitive reasons, without making the relationship a failure. A customer can succeed completely and then leave because its project ended or its need changed. The task is to explain departure, not describe every departure as preventable loss. When data is very sparse, use detailed case reviews instead of percentages that swing dramatically with one customer. The model helps create good questions, but cannot replace qualitative research, prove causation or predict an organization’s decision on its own.
Common mistakes and how to correct them
The first mistake is drawing an arrow from advocacy to awareness and assuming referrals will arrive automatically. Correct it by providing a clear, optional referral process, with appropriate value, consent and respect for the customer’s timing. The second is equating training completion with adoption; correct it by choosing a usage event linked to an outcome. The third is mixing new and older contracting cohorts in renewal rates: return to a cohort due within a defined period and disclose excluded contracts and the reason for each exclusion.
Other mistakes include using one stage to hide disagreement within an account, treating increased upselling as sufficient evidence of satisfaction, and changing an indicator’s definition after an uncomfortable result appears. Address them by recording stakeholders, reviewing value and cost together, and retaining the definition version and date of each change. Finally, do not set a target for every arrow just because it appears in the diagram. Some transitions are not directly measured, and some do not fit the business. Declaring a specific knowledge gap is better than manufacturing a complete-looking number that cannot support an honest decision.
Practical exercise with a suggested answer
Choose a business-to-business service whose delivery you understand, and identify one verifiable promise. Draw both sides and the purchase point, then write the customer’s question, the evidence needed and the person responsible for action beside each element. Next, use a hypothetical cohort of 50 contracts: 40 completed onboarding and 30 achieved core usage. Assume all fifty contracts became due for renewal at period-end, 35 renewed, and seven of those renewers provided qualified referrals. Calculate the rates, propose one intervention, and write down what these counts do not allow you to conclude.
Suggested answer: onboarding completion is 40 ÷ 50 × 100 = 80%; adoption among onboarded accounts is 30 ÷ 40 × 100 = 75%; adoption among all buyers is 30 ÷ 50 × 100 = 60%; renewal is 35 ÷ 50 × 100 = 70%; and participation in referrals among renewers is 7 ÷ 35 × 100 = 20%. These aggregates alone cannot establish adoption’s effect on renewal, because we do not know which of the thirty adopting accounts are among the thirty-five renewers. We need to link states at account level, then understand differences before claiming causation. An appropriate first intervention is to investigate why ten accounts did not complete onboarding, rather than assume a discount for everyone will solve the problem.
Practical conclusion: close one gap before expanding the map
The infinite loop’s value is not adding more journey stages. It makes the pre-purchase promise and post-purchase experience a single subject for accountability and learning. Start where meaning slips between two teams: a proposal that fails to explain its limits, a contract that does not define first value, or training that never turns into use. Gather evidence, assign responsibility, test a limited change, then review what happened using the same denominator and time window. The diagram then becomes a decision tool, not simply an attractive image in a strategy document.
Keep three questions in every review: did we understand what the account actually needs? Did we deliver the value we promised? Did we obtain evidence and consent before turning the experience into a message for others? Honest answers may lead you to stop a campaign, postpone expansion or repair onboarding, not merely increase spending. That is a mature use of the model: a relationship that can improve while allowing differences, reversals and endings, rather than a marketing machine assuming every customer will circulate forever.
Comments
No published comments yet.