
When we read that a company renting out AI computing capacity recorded more than a billion dollars in interest expense over six months, then watch South Korea’s stock market fall by about 8%, a natural question arises: has the AI bubble begun to burst? Answering it, however, requires separating three things: the usefulness of the technology, the profitability of the companies building it, and the prices investors paid to own those companies’ shares and debt. The technology can succeed while some of its financial backers struggle, and revenue can grow while financing that growth becomes harder.
The events of mid-October 2026 tested that distinction. Pressure on CoreWeave’s bonds raised doubts about financing the enormous expansion of data centers, alongside broader concerns about interest rates and valuations. The pressure spread to a Korean market heavily influenced by semiconductors. The explanation therefore cannot be reduced to one company having “brought down a country’s economy,” and a single rebound session is not enough to declare the problem over.
This article examines the facts available through October 16, 2026, explains how those concerns spread, and considers what they could mean for a business owner, marketer, or healthcare organization. Financial figures are tied to their stated reporting periods. The scenarios below are conditional analysis, rather than certain forecasts or personalized recommendations to buy or sell securities.
What Actually Happened in South Korea
On October 15, the KOSPI closed at 5,554.22, down 7.57%, while the KOSDAQ closed at 760.82, down 7.65%. During the session, the decline crossed the 8% threshold, and trading was temporarily halted for twenty minutes. “A fall of about 8%” is therefore a reasonable shorthand, provided the distinction between the intraday decline and the closing percentage is clear. This was a movement in stock indexes, rather than an equivalent decline in Korean economic output. Yonhap coverage, Details of the two indexes and the trading halt.
On October 16, the KOSPI rose 2.05% to 5,668.05, and the KOSDAQ gained 4.46% to 794.78. This represented an improvement in prices after the sharp sell-off, but did not fully recover the previous loss. Calculated from the closing levels, the first index remained about 5.67% below its October 14 close, and the second about 3.53% below. Daily percentage changes cannot simply be added together because the calculation base changes each day. Yonhap on the October 16 session.
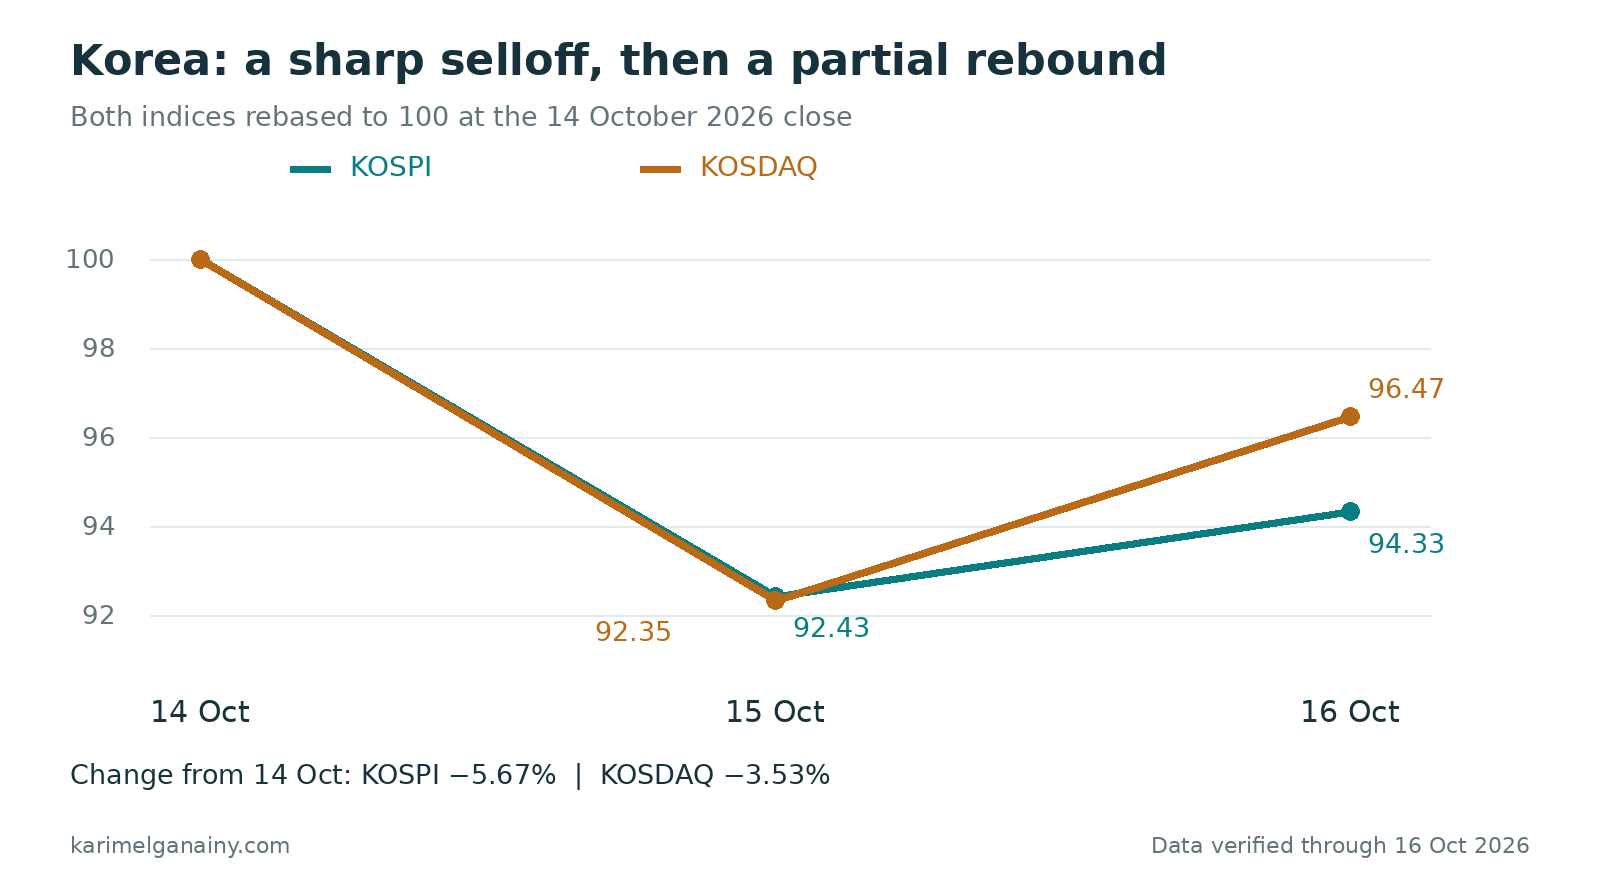
Figure 1. Both indexes are rebased to 100 at the close on October 14, 2026, to make the comparison easier; these are not their actual trading levels. Closing levels used: KOSPI 6,008.81, then 5,554.22, then 5,668.05; KOSDAQ 823.88, then 760.82, then 794.78. Source: Yonhap reports. The October 14 closes are calculated from the October 15 closes and the reported point changes. Calculations and chart prepared for this article.
Under Korea Exchange rules, the first stage of the circuit breaker is triggered when an index falls 8% or more and remains at that level for one minute; a reopening procedure follows the twenty-minute halt. This mechanism manages trading during extreme price movements. It does not determine stocks’ fair value or guarantee that the decline will stop. It should also be distinguished from the shorter “sidecar” restrictions on program trading. KRX rules for the KOSPI market, KOSDAQ rules.
How U.S. Financing Concerns Reach Korean Stocks
To understand the connection, imagine a U.S. company planning to rent out thousands of processors. It first needs to buy computing systems, which require processors, memory, networking, and cooling. If borrowing becomes more expensive, the company may revise its expansion plans or seek better terms from suppliers. Investors then reassess suppliers’ future sales before any problem appears in their current results. This is a possible economic channel through which pressure can spread; it is not evidence that every order has actually been delayed.
South Korea is particularly sensitive because Samsung Electronics and SK hynix are leading memory companies with a large presence in the market. Yonhap reported on October 13 that the two together accounted for nearly half the KOSPI market’s capitalization. This is an approximate, dated description of market concentration, rather than a precise official weight for each stock on the day of the sell-off. Declines in companies of this size affect the index more than equivalent percentage falls in smaller companies. Yonhap on market concentration.
There is also a direct industrial link: NVIDIA and SK hynix announced a multiyear partnership in June to develop memory and support AI infrastructure requirements. That commercial relationship helps explain why Korean investors watch U.S. spending on computing. It does not mean that the two companies have identical financial positions, or that a problem at one customer automatically reaches every supplier with the same force. Partnership announcement.
The simultaneous causes cited in market coverage included concerns about borrowing costs and how quickly AI investments would generate returns. Reuters gathered differing views on October 15: some focused on debt risks, others saw interest rates as the main driver, while others linked the correction to doubts about the pace and profitability of expansion. The existence of several credible explanations makes it inappropriate to treat CoreWeave as the “sole cause” of a session involving thousands of investment decisions. Reuters coverage and analyst reactions.
The trading session itself illustrates this transmission: Samsung shares fell 9.48% and SK hynix 11.06%. Yonhap cited concerns about competition in memory chips, the sustainability of AI investment, and borrowing costs. It also reported net foreign selling of about 3.6 trillion won. These are observations from a particular session. On their own, they do not establish that foreign selling caused all the losses or that leverage explained a specific portion of them. Yonhap on company shares and investment flows.
Who Sells What in the AI Economy
The term “AI companies” brings together different activities. Someone investing in a processor does not bear the same risks as someone renting that processor out, and an application user does not necessarily buy services directly from the company that owns the data center. Distinguishing these layers is essential to understanding who may benefit from demand and who bears the spending before the revenue arrives.
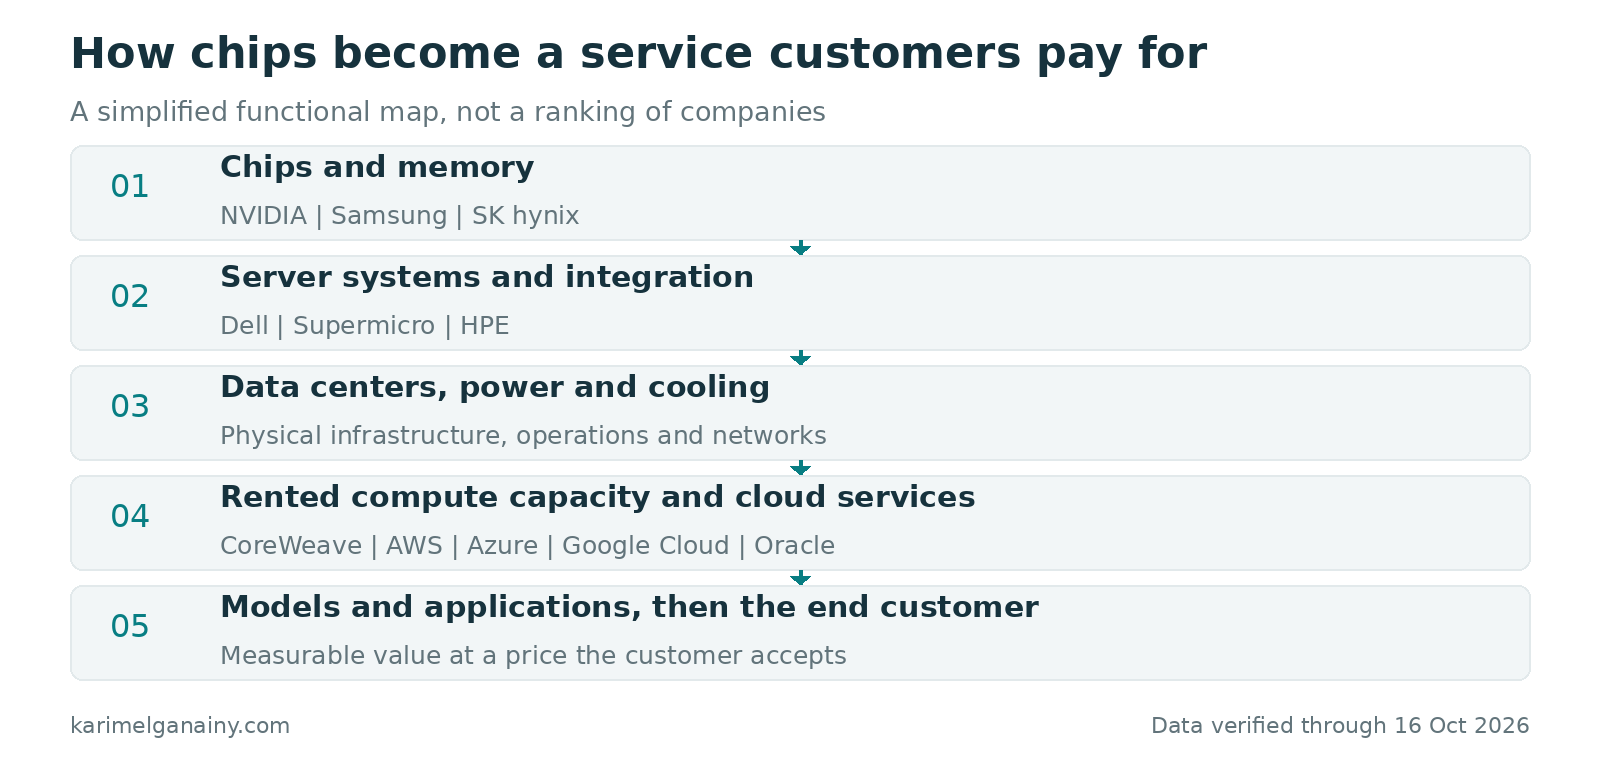
Figure 2. A simplified functional map. Some companies operate in more than one layer, and commercial relationships run in multiple directions. The company names are examples, rather than an exhaustive list or an investment ranking.
At the computing-design layer, NVIDIA develops processors, platforms, networking, and supporting software. Designing chips differs from manufacturing them at specialized foundries, and also from assembling them into a finished server. NVIDIA’s results and ecosystem show that its business extends to integrated platforms; describing it simply as a shop selling graphics cards understates its role. NVIDIA results for the quarter ended July 26, 2026.
At the memory layer, Samsung and SK hynix supply products used in computing systems, including high-bandwidth memory, or HBM. This market differs from software subscriptions: production capacity, product mix, technical qualification, and memory prices all matter. Samsung’s business also extends well beyond memory, as its disclosures on devices, displays, and other operations show. Samsung results, SK hynix results.
Next come server-system companies such as Dell, Supermicro, and HPE. They bring together processing, memory, networking, power, and cooling, and provide systems, deployment, and support services. They may benefit from rising orders, but face risks involving component costs, inventory, delivery, and assembly margins. Business details differ among these companies, so it would be wrong to assume that every dollar of server revenue converts into profit at the same rate. Dell results, Supermicro systems, HPE solutions.
At the operating layer, these systems need buildings, connectivity, electricity, cooling, and hands-on management. A cloud operator provides computing resources to customers, who may be model laboratories, application companies, or organizations. CoreWeave is an example of a cloud provider specializing in AI workloads, while AWS, Microsoft Azure, Google Cloud, and Oracle offer broader services. At the end of the chain is the customer who pays because a service solves a problem or delivers a benefit. Unless that benefit turns into sustained economic demand, promises made further up the chain become harder to finance.
What CoreWeave’s Billion-Dollar Interest Figure Means
The first-half figures appeared in the second-quarter disclosures published in August. They were therefore known before October’s turbulence. The new development was the market’s repricing of risk, rather than the discovery of a bill issued for the first time on the day of the sell-off. That timing distinction matters because older financial information can become more influential when interest rates or lenders’ appetite change.
From January through June 2026, CoreWeave recorded revenue of $4.653 billion, net interest expense of $1.176 billion, and a net loss of $1.366 billion. For the same period in 2025, the figures were $2.194 billion, $531 million, and $605 million, respectively. Net interest expense was equivalent to about 25.3% of first-half 2026 revenue, based on a simple calculation using the reported figures. This is a measure of the financial burden, rather than a profit margin. Company earnings release.
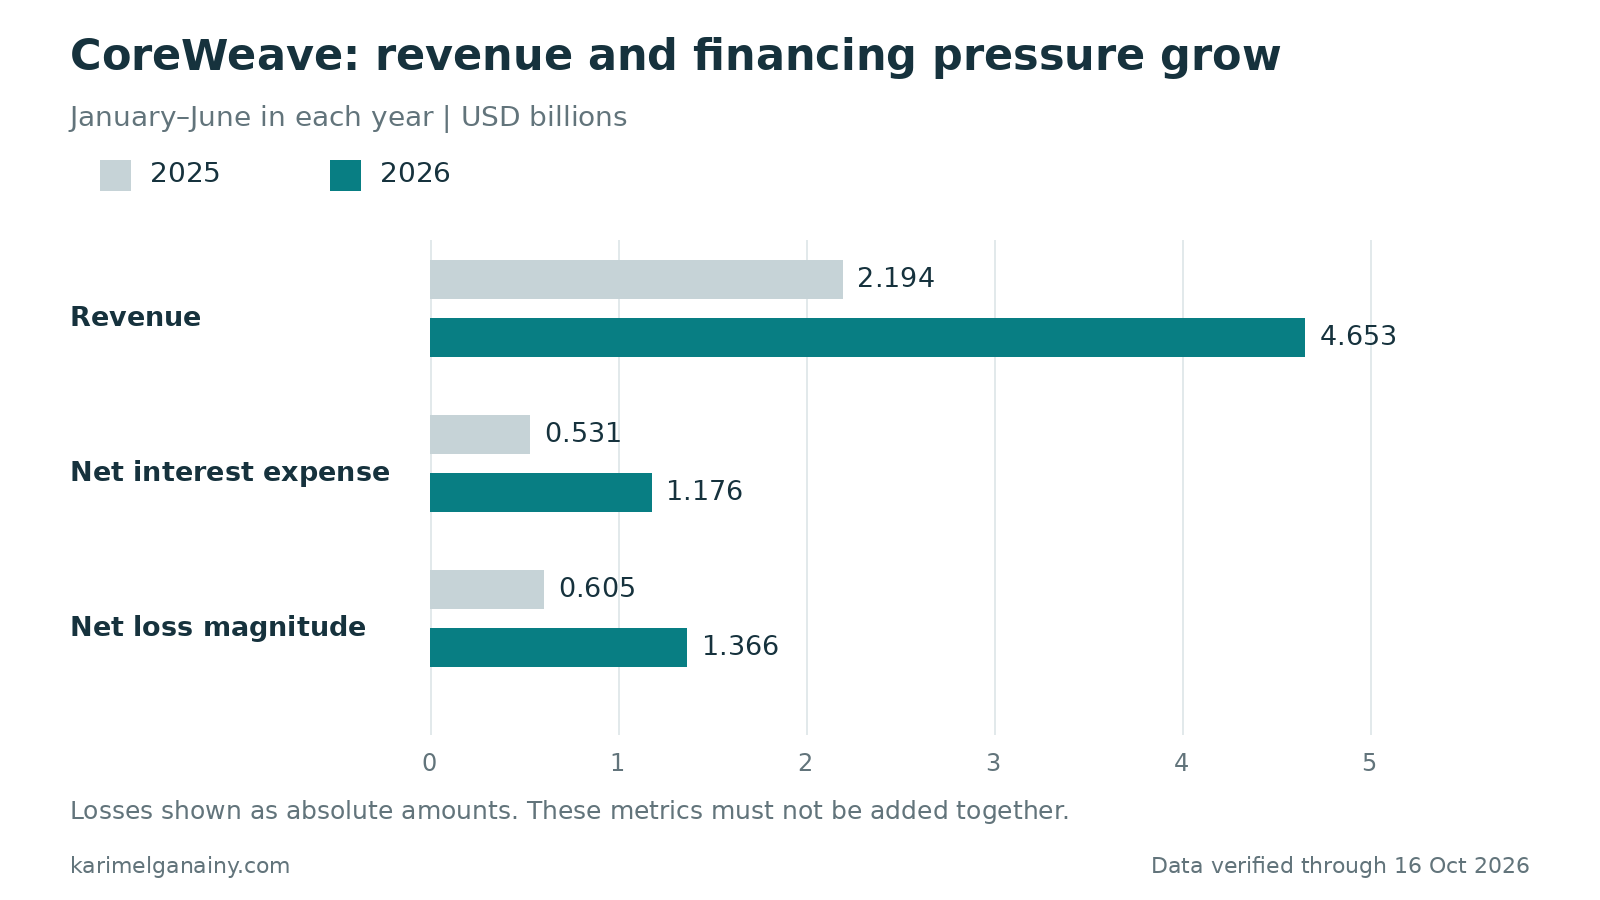
Figure 3. Billions of dollars, January through June of each year. Losses are shown as absolute amounts to illustrate their size, rather than as positive profits. The items are not components that can be added together. Source: CoreWeave’s second-quarter 2026 disclosure.
The interest measures differ: contractual interest was $1.075 billion, and cash interest paid excluding capitalized interest was $806 million. Adding $176 million of capitalized interest brings total cash interest paid to $982 million. Capitalization adds a cost to an asset rather than charging it immediately against income. These are overlapping measures with different timing and classifications; they must not be added together as separate bills. Form 10-Q and the interest and cash-flow disclosures.
The useful question is whether the assets’ ability to generate cash is growing enough to cover their operation, replacement, and financing. Losses during expansion may make commercial sense, but that does not eliminate their cost. Conversely, high interest expense alone does not establish that a default has occurred. Default involves a failure to meet specific obligations or conditions, and requires independent evidence that it has happened.
Where the Real Financial Risk Is Concentrated
The risk begins with the gap between the pace of spending and the pace of recovering that investment. The first half showed positive operating cash flow of $3.663 billion, against cash purchases of property and equipment of $14.117 billion. The arithmetic difference is a $10.454 billion shortfall before financing flows and other items. It is neither an equivalent decline in the bank balance nor a definitive measure of all cash requirements. Financial tables accompanying CoreWeave’s results.
Collecting customer prepayments can improve operating cash flow while leaving an obligation to provide the service later. It is therefore important to examine where the cash comes from and when obligations fall due, rather than treating every positive inflow as recurring profit. Likewise, rising capital expenditure does not automatically signal failure; it may build productive assets. The questions are what those assets cost to build, how much they are used, their economic life, and the terms of their financing.
On June 30, the carrying amount of debt was $35.068 billion, and cash and cash equivalents totaled $5.524 billion. Reported liquidity of $15.553 billion included $10.014 billion of undrawn facilities; drawing on those facilities is conditional, and they are not freely available cash. Principal maturities were $4.413 billion for the remainder of 2026 and $6.184 billion in 2027. This is a June snapshot, rather than an October balance. Debt note in Form 10-Q.
Operating lease liabilities had a present value of $16.319 billion. They should be distinguished from debt and from undiscounted payments to avoid double counting. The two largest customers accounted for 40% and 23% of first-half revenue; their names were not disclosed in the concentration table. Lease and concentration notes in Form 10-Q.
One clear example of timing risk is the $2.6 billion facility announced in August, with an average debt tenor of about five years, compared with average customer contracts of about three years. This structure provides flexibility, but leaves a period that requires contract renewals or renting the assets to other customers. The quality of the current customer does not remove the question of what happens after its contract ends. Facility announcement.
In contrast, the $8.5 billion DDTL 4.0 facility in March received an investment-grade rating at the project level, with its floating-rate tranche priced at SOFR plus 2.25 percentage points. This illustrates how collateral, contracts, and financing structure can improve terms. It does not give all the company’s debt the same rating. Treating all debt as uniform misses these distinctions, just as treating every commercial contract as an absolute guarantee does. Company presentation on project financing.
Why the Backlog Does Not Settle the Debate
The contracted revenue backlog reported by the company stood at about $104 billion at the end of June. The figure helps convey the scale of expected demand, but it is spread over time and depends on delivering capacity under the agreed terms. It is not cash in the bank, net profit, or a guarantee that every data center will start operating on schedule and at the expected cost. CoreWeave earnings presentation.
A common mistake is to divide that backlog by debt and then declare that coverage is guaranteed. First, the costs of operating the service, building capacity, meeting lease obligations, and paying taxes must be deducted, and the timing of collections must be matched against the timing of repayments. In a hypothetical teaching example, a multiyear contract worth 100 does not necessarily pay an installment of 20 due next month, even if the contract has attractive economics. The potential problem here is liquidity and timing, which may differ from a project’s lack of long-term profitability.
On the positive side, continuing to sign contracts at viable prices, diversifying customers, and bringing capacity online on schedule can strengthen the economics of the business. In September, CoreWeave announced short contracts of three to six months at higher prices, alongside more than $25 billion in net new commitments added early in the third quarter and announced on August 11. This information comes from the company. Prices on short contracts should not be generalized to the entire portfolio or assumed to persist. Update on prices and commitments.
A High Bond Yield Does Not Immediately Change All the Company’s Interest Costs
Bloomberg reported on October 14 that unsecured bonds due in 2032 were trading below 80 cents per dollar of face value, at a yield above 15%. This indicates the return the market demands for taking the risk of that particular security. It is not an announcement that all the company’s debt now pays a 15% coupon. Bloomberg report.
The coupon is the contractual payment, while the yield is affected by the bond’s purchase price and the cash flows expected through maturity. When the price of a fixed-coupon bond falls, its yield generally rises, while the contractual payment remains unchanged unless the terms change. However, higher market yields may make issuing new debt or refinancing more expensive. This is where market movements can reach the underlying business. SEC explanation of the relationship between bond prices and interest rates.
In the other direction, on September 22 CoreWeave closed a $4.2 billion convertible note issuance carrying 2.875% interest and maturing in April 2033. This demonstrates that the company had access to financing at that time, but does not make the financing cheap without a trade-off: the conversion option has value and may involve dilution of shareholders’ ownership. Its coupon should not be compared directly with the yield on a conventional bond, nor should its proceeds automatically be added to June’s cash to guess the current balance. Official disclosure of the completed issuance.
Why CoreWeave’s Risks Differ from Those of the Cloud Giants
The comparison should focus on business models and financing capacity, rather than simply noting that everyone buys processors. A specialized company may use debt to get ahead of demand and build capacity quickly. A diversified provider, meanwhile, has established businesses capable of generating cash, along with multiple customers and services. This does not make large companies immune to overinvestment, but it changes their room to maneuver if returns are delayed.
For the calendar quarter ended in June 2026, Microsoft reported operating cash flow of $55.441 billion and cash additions to property and equipment of $35.802 billion. These are figures for the entire group, rather than Azure alone. They illustrate an established business’s ability to finance part of its investment, but do not permit a direct comparison of that quarter with CoreWeave’s half-year figures or imply that the two groups have equivalent obligations. Microsoft results.
In the same quarter, the AWS segment recorded revenue of $42.2 billion and operating income of $16.6 billion. It is, however, a segment within Amazon, rather than an independent company with separately published financing statements. Amazon also reported negative free cash flow on a trailing-twelve-month basis, illustrating that diversification and profitability do not prevent investment from putting pressure on cash. We do not make an arithmetic comparison between this annual measure and CoreWeave’s half-year shortfall. Amazon results.
Google Cloud offers a range of computing, data, and AI services, while Oracle combines applications, databases, and cloud infrastructure. These activities distinguish them from a more narrowly specialized provider, but Oracle is also expanding its spending and obligations. It should therefore not be treated as a financial replica of Microsoft or Amazon. A sound comparison requires a schedule of debt, liquidity, spending, and contracts for each company, using the same dates and definitions. Google Cloud services, Oracle disclosure for the fiscal quarter ended August 2026.
| Business | What it sells | Pressures worth watching |
|---|---|---|
| NVIDIA | Processors, platforms, networking, and software | Customer spending growth, competition, and product cycles |
| Samsung and SK hynix | Memory and semiconductor components | Prices, production capacity, and product mix |
| Dell, Supermicro, and HPE | Server systems, integration, and services | Component margins, inventory, and delivery |
| CoreWeave | Specialized cloud capacity | Financing, contract renewals, and asset utilization |
| AWS, Microsoft, and Google | Cloud and diversified services within larger groups | Returns on spending, sustainable growth, and financing capacity |
| Oracle | Applications, databases, and cloud infrastructure | Pace of expansion, cash flows, and obligations |
This is a functional comparison, rather than a credit rating or a ranking of stocks. Companies in the same row are not identical, and the risks listed cannot be turned into numerical estimates without additional data.
Technology Can Improve While Some Companies Lose Value
A newer processor may offer a lower cost per task. That benefits the user, but puts pressure on the economic value of older equipment if its owner has to lower the rental price. At the same time, older equipment may remain viable for tasks that do not require the highest performance. There is therefore no sound rule that every old processor becomes worthless as soon as a new generation appears. Nor is an assumed accounting life enough to establish that the equipment can command the same price throughout that period.
Consider a hypothetical example: a project buys capacity worth 100 and expects annual net operating cash flows of 25 before debt service. If operations begin a year late, or cash flows fall to 15 because of pricing or utilization, repayment capacity changes even if the number of users rises. These figures are illustrative only. The point is that growth in usage, growth in revenue, and returns on capital are three different outcomes, and each must be measured.
Similarly, a loss of market capitalization does not mean the same amount has left the company’s bank account. The share price reflects the market’s valuation of shareholders’ equity. Changes affect wealth and the cost of raising new capital, but are not automatically recorded as a cash expense for the company. A data center can therefore keep operating while its share price falls, and a project can face financing difficulties even before recording a large operating loss. Prices need to be connected to contracts and cash, rather than used as a substitute for them.
What This Means for Pricing and AI Adoption
There are opposing possible paths. If available capacity grows faster than demand, prices for some computing services may fall and buyers’ terms may improve. If financing difficulties slow construction while demand continues, however, cutting-edge capacity may remain scarce and become more expensive to obtain. Both paths could coexist: discounts on older equipment alongside constraints on newer systems or in particular regions. A uniform direction for cloud pricing cannot be inferred from whether stock-market screens are red or green.
Changes in processor costs do not flow directly into the price an individual pays for an application subscription. Between the two sit development, storage, networking, support, security, and distribution costs, as well as commercial pricing that may remain fixed for a period. A business owner needs to track the actual terms of the service: usage limits, price changes, long-term commitments, data-transfer costs, and exit options. Those details are more directly relevant to the budget than a forecast for a supplier’s share price.
Practical adoption can also continue through a financial correction. Companies using AI to reduce the time needed for a measurable task may find a reason to continue, while experiments that fail to demonstrate a benefit lose support. A good test starts with a small task and a clear baseline, then compares time, quality, errors, and total cost after implementation. An increase in the volume of generated content alone does not establish that the investment improved outcomes.
What Matters to Marketers and Healthcare Organizations
For a marketing agency or a small retailer, the useful question is the cost of an acceptable result. A system may generate more drafts, but those drafts still require fact-checking, design, and legal or editorial review, depending on the activity. Count team time, revisions, and integration, then compare them with the resulting quality, speed, or business outcomes. Avoid signing an expensive commitment simply because the provider is making headlines, or abandoning a useful tool merely because shares in its sector have fallen.
In healthcare, administrative and marketing tools should be distinguished from uses that affect clinical decisions. An organization might consider a limited trial for drafting general content or organizing internal processes, with human review and appropriate controls. Patient data and treatment claims, however, require specialist assessment of privacy, accuracy, and compliance in the relevant country. A low price or a well-known cloud provider does not replace that assessment, and this article does not establish that any particular product is suitable for medical use.
Supplier reviews should also include a continuity plan: how can data be exported? Which alternative services have been tested? Who reviews the outputs? What happens if service is interrupted or its terms change? This does not always require duplicating the entire system across two providers. Sometimes retaining original files, documenting procedures, and having a temporary manual alternative are enough. The level of backup should reflect the effect of an interruption on the customer, rather than the level of market anxiety.
The Gulf, Energy, and Jobs
In the Gulf, digital infrastructure projects can create demand for engineering, cooling, networking, and services. Assessing a particular project, however, requires examining the costs of power, grid connection, and financing, as well as the customer and the contract. It cannot rest on the assumption that access to capital or energy alone guarantees a profit. If global financing tightens, some projects may slow, or strong buyers may gain different negotiating terms. Both are conditional scenarios, rather than a uniform forecast for every country.
In its 2026 update, the International Energy Agency states that data-center electricity demand reached 485 terawatt-hours in 2025, and projects about 950 by 2030 in its central pathway. The latter figure is a forecast, rather than consumption that has already occurred. The agency highlights bottlenecks involving grid connections, chips, and financing. The effect on local electricity bills depends on grid capacity, how expansion costs are allocated, and regulatory policy. It would therefore be wrong to assert that every new data center will increase household bills. International Energy Agency update.
As for jobs, a single sell-off session cannot be converted into a reliable number for layoffs or hiring. Slower construction may reduce some projects’ demand for labor, while continued application deployment may create needs in integration, security, data management, and review. Tasks within a job may also change before the number of employees does. The practical step for an employee or manager is to identify the skills and processes changing in their own business, rather than planning around a sweeping prediction that all jobs will disappear or flourish.
Which Signals Are Worth Watching Next?
The better scenario requires more than a rising share price: capacity coming online on schedule, commitments turning into revenue and cash collections, prices remaining high enough to deliver adequate returns, a more diverse customer base, and financing on sustainable terms. Along this path, early investment may prove to have given some companies a strong position, while the financial correction removes excessive pricing without disrupting actual adoption.
The more difficult scenario combines execution delays with falling asset utilization or rental prices and rising financing costs. The cash gap could then widen, forcing some companies to issue shares, sell assets, or revise expansion plans. These factors need not all occur, and the presence of one does not make the outcome inevitable. They do, however, identify where to look for evidence in subsequent disclosures.
For a structured review, ask five questions: has the cash position after spending improved? Have debt maturities and terms changed? Has concentration fallen, and have cash collections materialized? Is the promised capacity actually operating? And is the end customer paying because the application delivers measurable value? Tracking the answers over time is more useful than selecting a huge backlog figure to prove the optimistic case, or a huge interest figure to prove a collapse.
Conclusion
CoreWeave’s story shows that the AI challenge includes financing infrastructure and the timing of its returns, alongside developing the technology. South Korea’s sell-off shows how concerns move among lenders, operators, and chip suppliers through an interconnected global chain and a concentrated local market. Strong demand does not eliminate debt risk, and debt pressure does not prove that demand is imaginary. The most useful analysis tracks who pays, when they pay, what it costs to provide the service, and who bears the risk if returns are delayed.
Sources and Reading Method
Financial figures come from company and SEC disclosures, and market-session data from the linked news sources above. Charts and derived calculations are identified; scenarios and examples are analysis rather than reported events. Last verified October 16, 2026. June balances are dated figures and do not represent an October balance sheet.
The cover is an original editorial illustration, not documentary imagery of a data center or a real trading screen.
Comments
No published comments yet.