
Scope: 18 selected listed companies, not a census of healthcare or an estimate of market size. Period: 2021–2025; evidence reviewed through 15 October 2026. Cover imagery is illustrative, not documentary imagery of the companies’ facilities.
Download the Arabic PDF report, CSV data, and JSON data and sources.
Detailed charts and data: 18 companies across five years
Values are in SAR million. Open any chart to view it full size; tables scroll horizontally. A dash means unavailable or unsuitable for comparison, never zero. Each plot uses an independent scale, so line heights are not comparable across companies. Tables round values to two decimal places.
Revenue growth is an important signal in healthcare. It shows that a business is generating more sales, often while serving more patients, opening facilities, extending distribution or building new services. But revenue alone cannot tell a hospital operator, pharmacy executive or pharmaceutical manufacturer whether expansion is becoming more productive. The crucial question is how that growth reaches operating profit, cash collection and, ultimately, net profit attributable to shareholders.
A comparison of selected Saudi-listed healthcare businesses from 2021 to 2025 reveals several different growth stories. Large hospital groups expanded, sometimes ahead of the earnings contribution of new facilities. Pharmacy businesses increased sales while absorbing the cost of digital services, distribution and new locations. Pharmaceutical manufacturers delivered very different outcomes depending on product mix, cost control, currency exposure and commercial execution. Smaller providers demonstrate why a high growth rate can coexist with a fragile or unusually strong comparison year.
For healthcare management and marketing teams, the value of this comparison is practical. It helps distinguish an acquisition from organic demand, an accounting gain from repeatable earnings, and a busy facility from a financially productive one. It also shows why marketing decisions need to be connected to service capacity, the patient journey and revenue-cycle performance.
This article is business and marketing analysis, not investment advice. Its recommendations are reasoned proposals, not company commitments, forecasts or guarantees of return.
Scope: a comparison of companies, not the size of Saudi healthcare
The analysis covers selected listed operators for which public annual revenue and net-profit evidence was located. It includes hospital groups, pharmacy retailers, manufacturing-led pharmaceutical groups and a smaller-provider panel. It is neither a census of all private healthcare providers nor a calculation of the Saudi healthcare market. Private companies may not publish comparable accounts, and listed consolidated groups may include activities outside their principal sector or outside Saudi Arabia.
Amounts are expressed in millions of Saudi riyals unless stated otherwise. The primary profit measure is net profit attributable to owners after zakat and tax where that distinction is available. This differs from total consolidated profit when non-controlling interests exist. The pharmacy figures follow the consolidated reported-profit basis identified in their sources. This means margins across different business models are descriptive, not a clean league table of management quality.
The period is the five calendar years ending in 2025. Publication and comparison evidence was assembled as of 15 October 2026. Where later reports present revised comparatives, those figures generally take precedence over the original announcement. Material exceptions and unresolved revisions are stated explicitly. The reviewed panel contains 18 companies and 90 company-year slots, including intentionally blank values where a comparable result could not be verified. Missing values are left missing: no annual figure is estimated from a half-year result, and a listing date does not erase audited financial history from before the initial public offering.
Hospitals: expansion is visible before its full earnings contribution
Dr. Sulaiman Al Habib Medical Services Group increased revenue from SAR 7,250.47 million in 2021 to SAR 13,706.90 million in 2025. Owner-attributable net profit increased from SAR 1,376.62 million to SAR 2,401.47 million. The intermediate revenue figures were SAR 8,310.74 million in 2022, SAR 9,508.44 million in 2023 and SAR 11,200.43 million in 2024. This is a substantial expansion in the scale of the consolidated business, but the final year illustrates why revenue and profit should be examined together. Sources: HMG historical financial table, 2025 Saudi Exchange announcement.
In 2025, revenue grew much faster than profit. Management linked sales growth to patient activity, occupancy and contributions from hospitals and pharmacies, while new hospitals brought fixed costs that affected profitability during their development. A new facility creates staffing, depreciation and operating obligations before utilization reaches a mature level. The commercial implication is to evaluate a new hospital by its own development stage rather than comparing it immediately with an established flagship. Marketing should help connect the right patients and referral sources to available clinical capacity, without generating demand for services that are not yet ready.
Mouwasat presents a different final-year pattern. Revenue rose from SAR 2,144.14 million in 2021 to SAR 3,222.58 million in 2025; owner-attributable profit rose from SAR 578.16 million to SAR 822.04 million. Profit moved from SAR 657.69 million in 2023 to SAR 645.76 million in 2024 before recovering in 2025. The recovery therefore needs to be read against the intervening decline, not simply as a straight-line improvement. Sources: historical table, 2025 announcement.
Higher patient visits and inpatient occupancy supported Mouwasat’s 2025 result. Lower expected-credit-loss provisions, collection of older balances and lower borrowing costs also helped, partly offset by Yanbu pre-opening costs. This combination matters: collecting a previously outstanding bill improves the financial outcome without being a new marketing conversion. Managers should therefore maintain separate explanations for demand generation, service delivery and collection. Otherwise, commercial teams may receive credit for financial movements they did not create, while collection improvements receive too little attention.
Dallah’s revenue increased from SAR 2,105.18 million in 2021 to SAR 4,066.89 million in 2025, while owner-attributable profit increased from SAR 258.60 million to SAR 538.27 million. Its 2025 acquisitions provide an especially useful distinction between organic and acquired growth. The Al Khobar and Al Ahsa facilities, consolidated from 23 March 2025, contributed SAR 572 million of revenue, equivalent to 66.4% of that year’s revenue increase. Existing facilities contributed a further SAR 289 million. Sources: Dallah financial series, issuer explanation.
The management task after an acquisition is broader than adding advertising. Referral pathways, appointment access, insurer arrangements, service information and the patient experience must work across the enlarged organization. The marketing dashboard should separate acquired revenue, existing-facility growth and cross-network referrals. Reported earnings also included non-recurring items, including a SAR 51 million land-contribution gain and a SAR 29.5 million Murabaha remeasurement gain. These items should be identified before attributing the profit increase to clinical operations or commercial execution. Sources: land gain disclosure, remeasurement disclosure.
National Medical Care increased revenue from SAR 845.38 million in 2021 to SAR 1,600.36 million in 2025. Net profit increased from SAR 136.36 million to SAR 318.47 million. The 2025 annual report presents the 2024 comparative as SAR 294.70 million, rather than the SAR 298.2 million found in older coverage. Management reported higher patient volumes and referrals, a full-year Al Salam contribution and expansion at ReLib. Its prior-year result also included approximately SAR 72 million of one-off legal and zakat reversals. Source: Care 2025 annual report.
Care’s example illustrates a common interpretive problem. Modest reported net-profit growth can coexist with stronger underlying progress when the earlier year benefited from a non-recurring release. Equally, the full-year contribution of an acquired facility changes the comparison. The useful response is a documented earnings bridge, not an unsupported “adjusted” number. Analysts should show which adjustment comes from management, which is calculated independently and whether the information is sufficient to reproduce it.
Al Hammadi makes the reverse warning clear. Revenue rose from SAR 1,153.88 million in 2024 to SAR 1,234.53 million in 2025, while net profit declined from SAR 338.80 million to SAR 241.86 million. The earlier year included a SAR 55.27 million land-sale gain. Higher expenses, expected credit losses, goodwill impairment and lower finance income also affected the later result. Sources: annual results table, 2025 issuer announcement.
The lesson is not that commercial growth has failed whenever net profit falls. It is that management must identify what changed. If the pressure comes from claims quality, a broader advertising campaign does not repair the underlying collection problem. If capacity utilization is weak, carefully targeted patient access initiatives may help. Different causes require different interventions, even when the headline outcome looks similar.
A necessary caution: Saudi German’s revised history
Middle East Healthcare, associated with Saudi German Health, recorded revenue of SAR 1,872.62 million in 2021 and SAR 3,102.63 million in 2025. The historical profit series requires more caution. Its 2023 net profit was restated to SAR 17.04 million, compared with an originally published SAR 180.18 million. The 2024 annual report confirms the much lower restated comparison. Treating the original and restated figures as interchangeable would materially distort the growth story. Sources: 2024 annual report, 2024 historical table.
The 2026 interim release says that the 2024 and 2025 comparatives were restated for matters involving property, plant and equipment, depreciation, receivables and expected credit losses. It also reports a qualified review conclusion because the reviewer lacked sufficient evidence to evaluate the corrections. Consequently, this comparison leaves the comparable 2024 and 2025 annual profit cells blank. Previously published annual profits are retained only as superseded historical disclosures, not used for rankings, margins or growth calculations. A previously reported land-sale gain also makes any simple equation of headline profit with operating progress inappropriate. Source: Saudi German primary H1 2026 release.
This qualification concerns the interim review and must not be casually described as an unchanged annual audit opinion. The relevant business risks are the reliability of financial information, the quality of receivables and the ability to reconcile historical results. They warrant attention, but they do not by themselves establish insolvency or misconduct.
This is a data-quality issue with strategic consequences. A management team that uses an inconsistent historical baseline can misjudge the performance of a facility, campaign or acquisition. Historical revisions belong beside the chart, where the reader can see them, rather than in an obscure note that appears only after a conclusion has already been drawn.
Hospital and healthcare groups
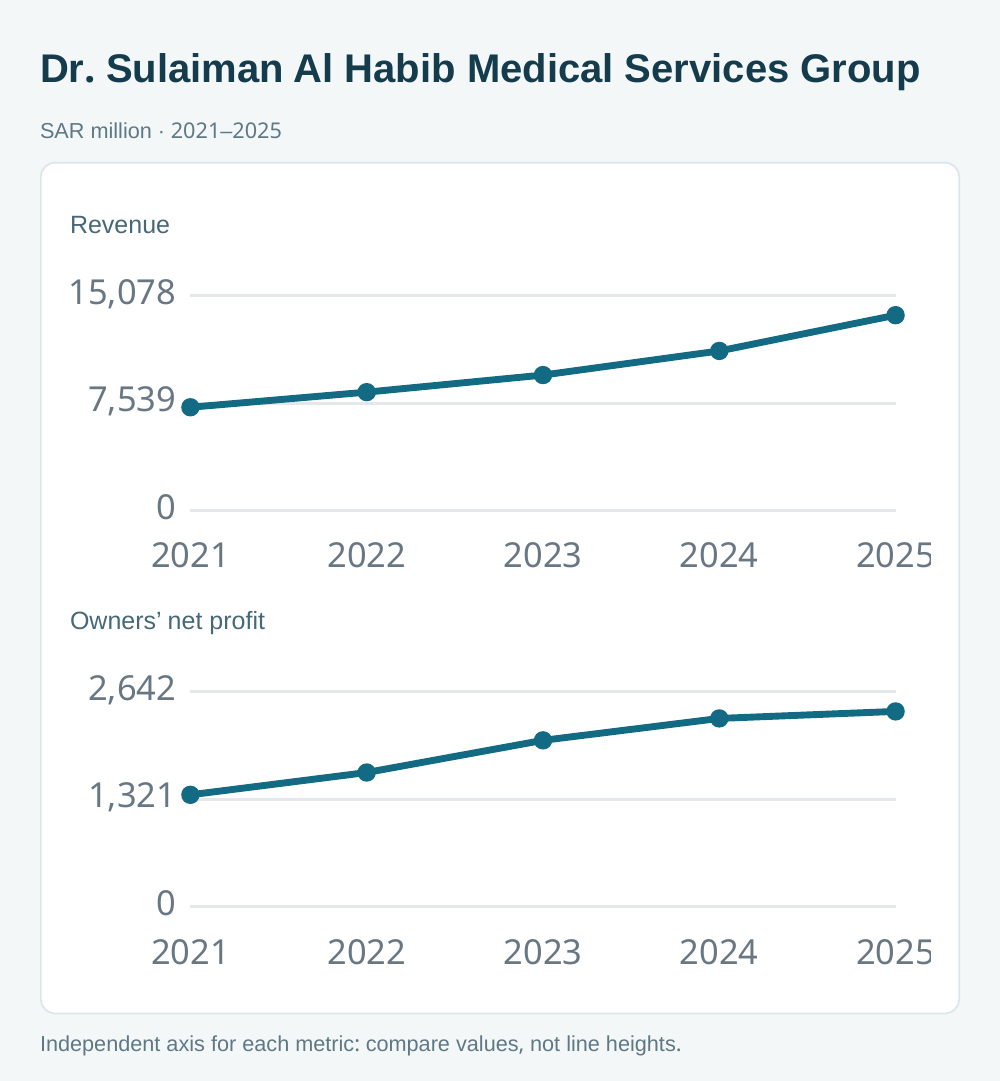
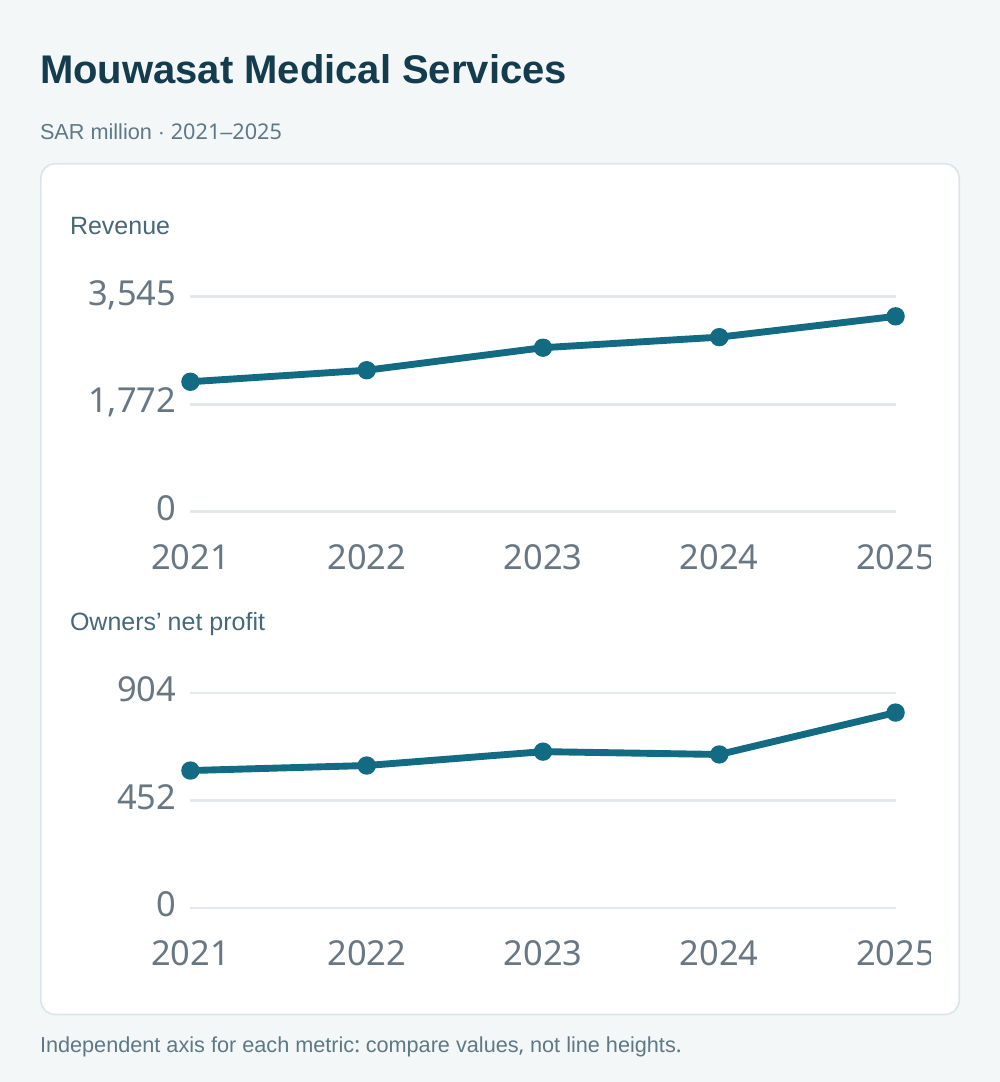
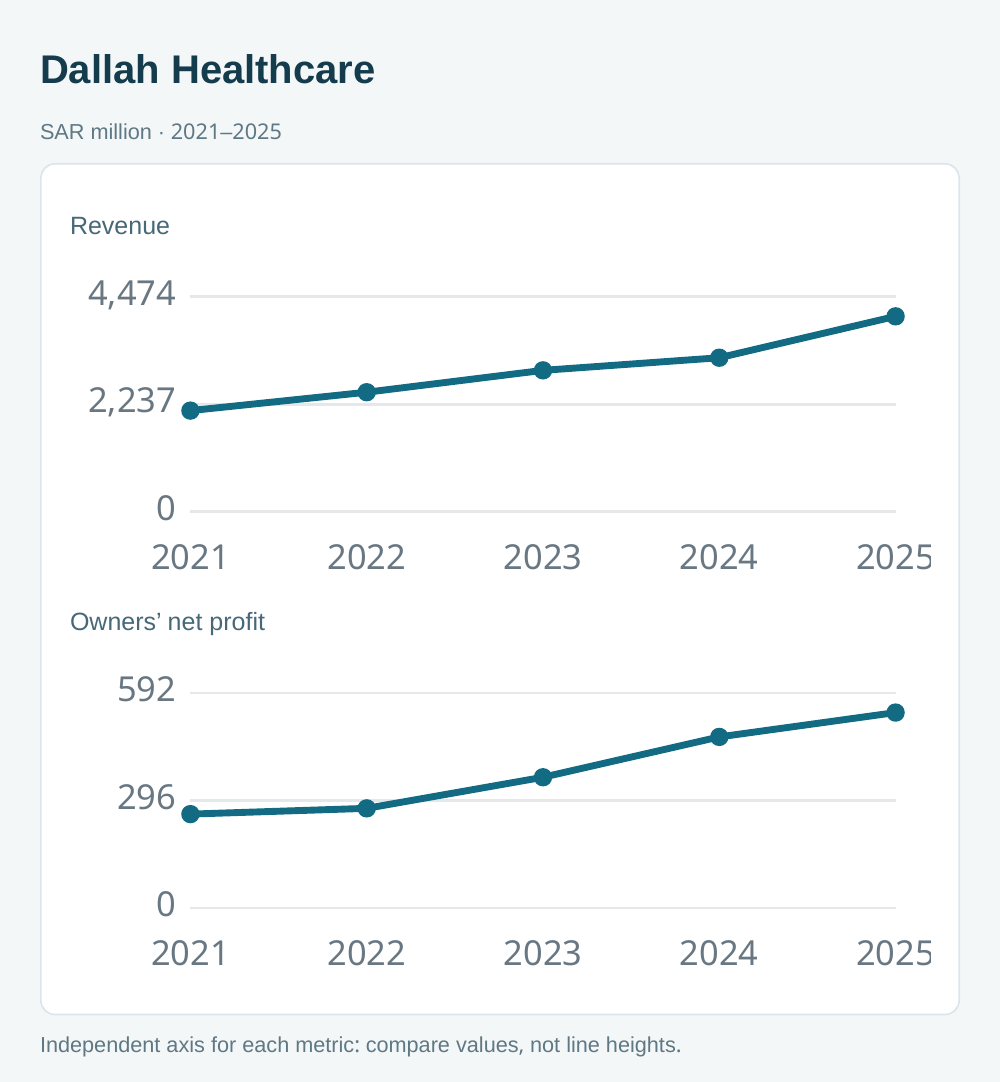
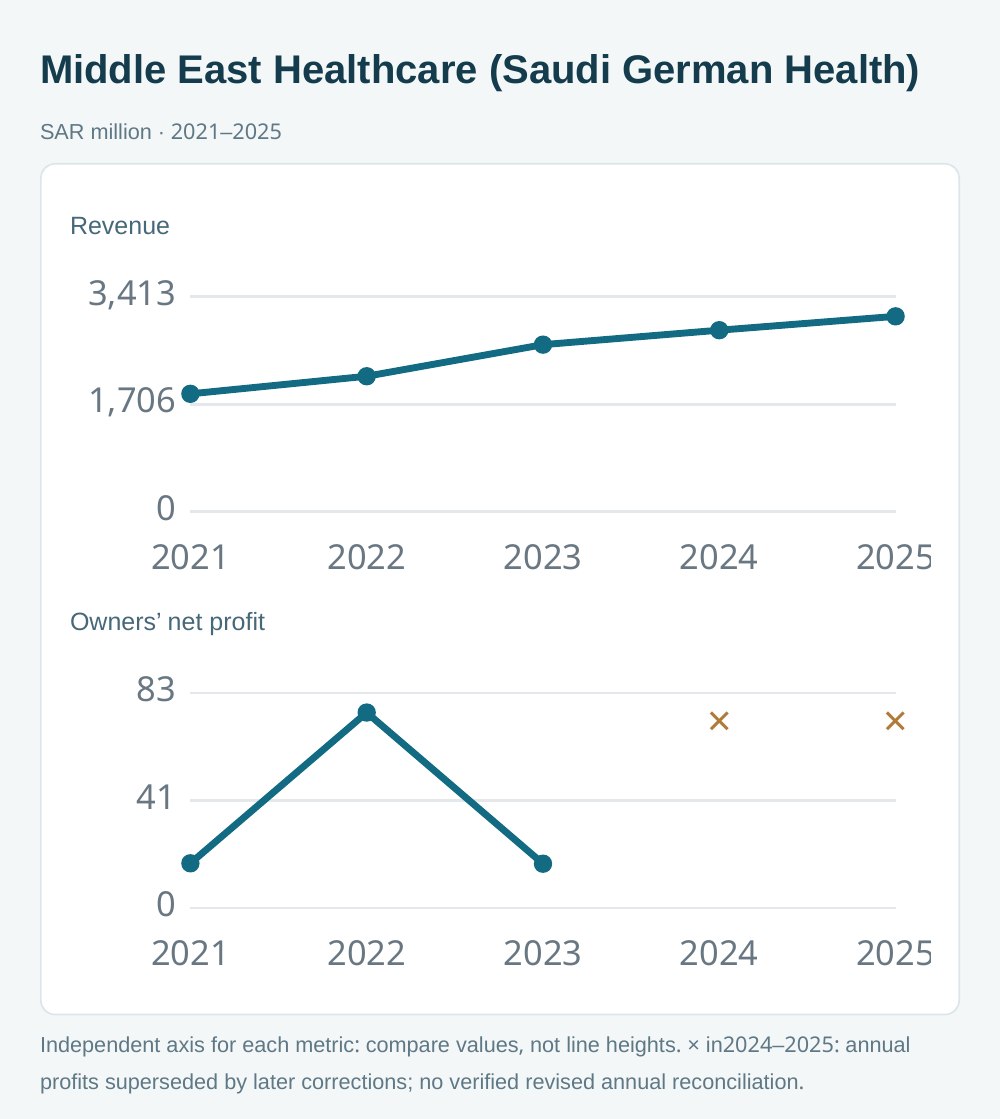
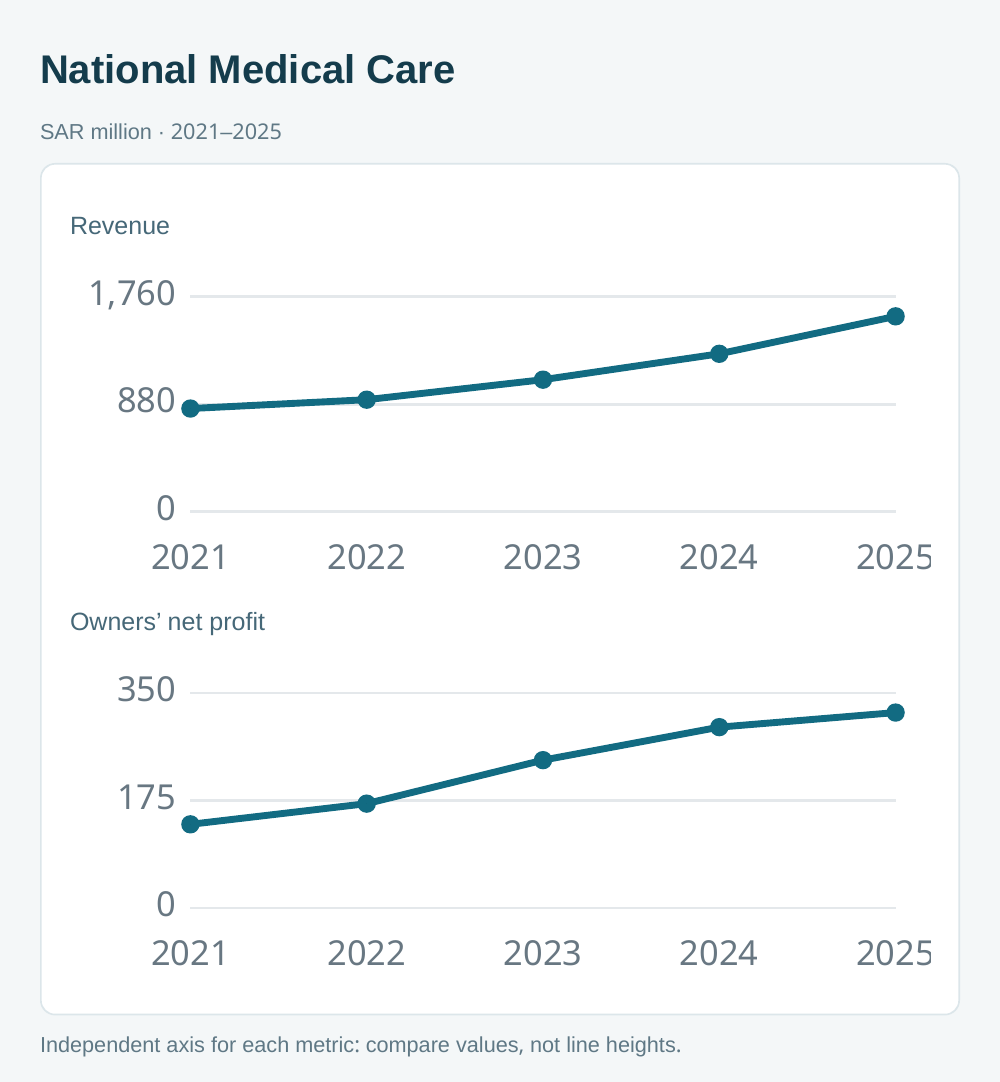
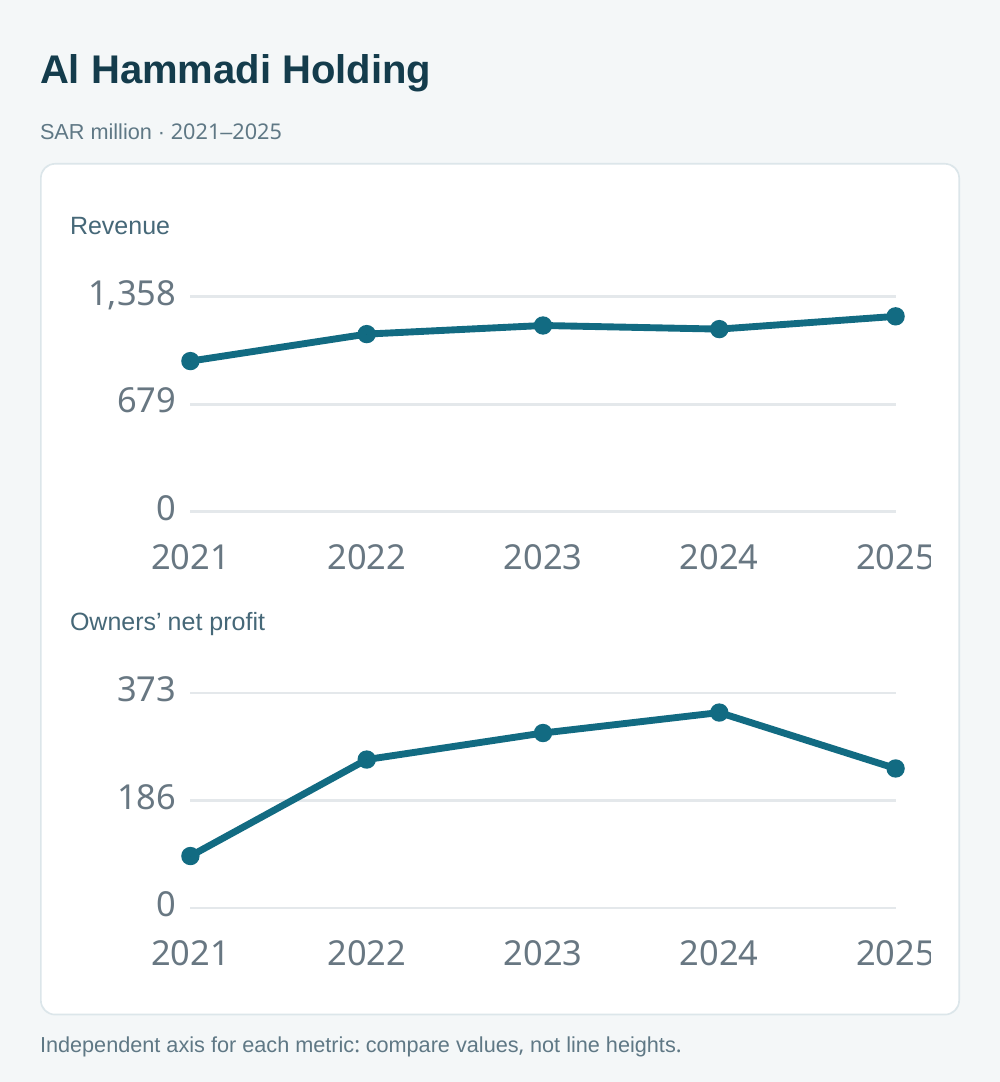
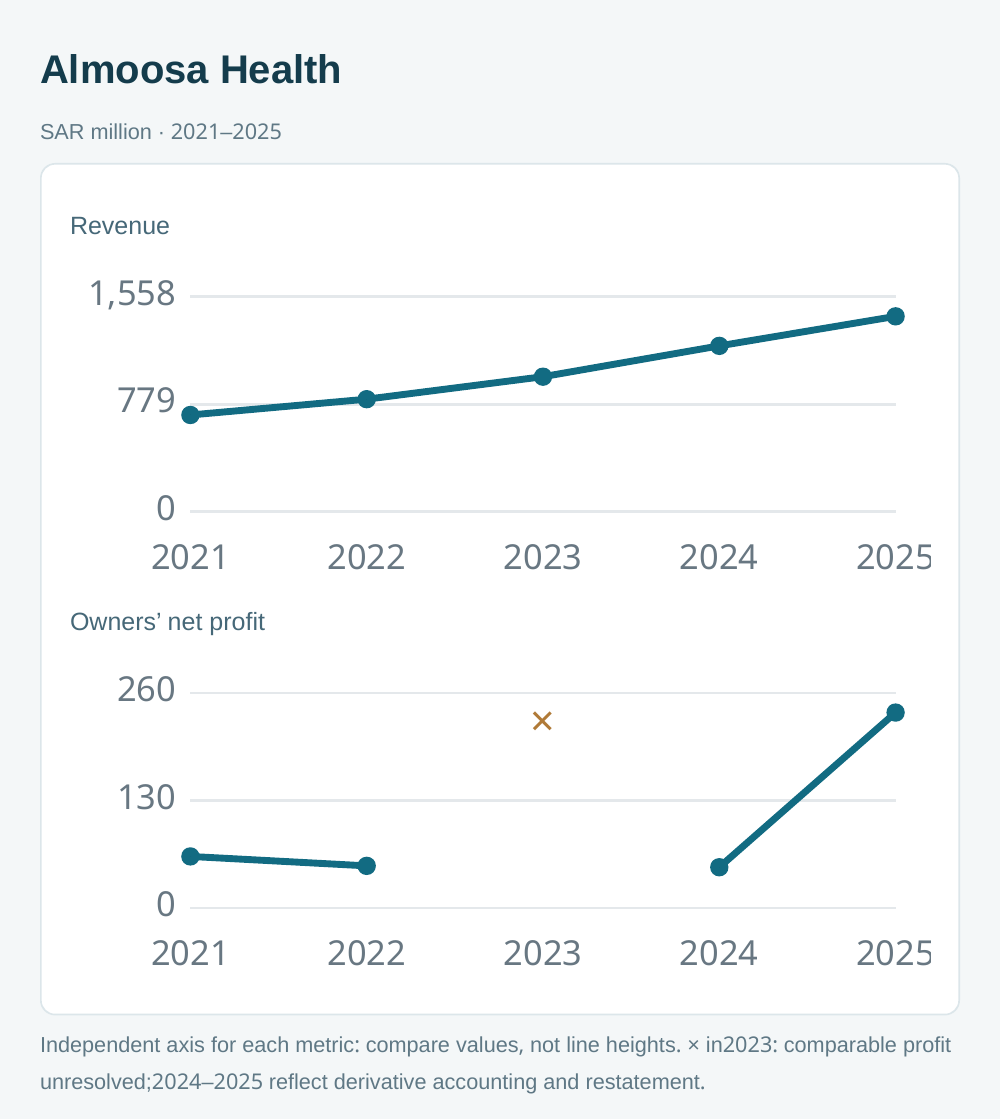
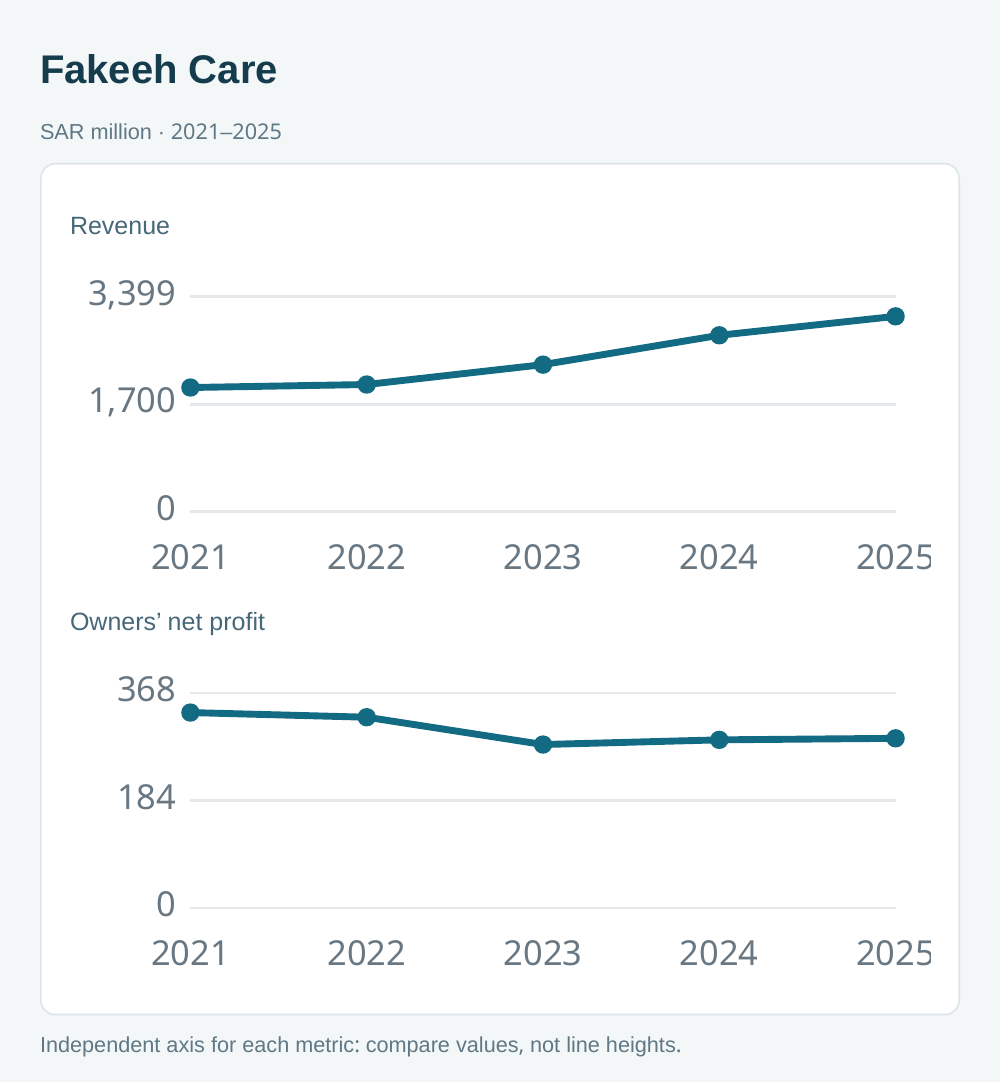
Revenue — SAR million
| Company | 2021 | 2022 | 2023 | 2024 | 2025 |
|---|---|---|---|---|---|
| Dr. Sulaiman Al Habib Medical Services Group | 7,250.47 | 8,310.74 | 9,508.44 | 11,200.43 | 13,706.90 |
| Mouwasat Medical Services | 2,144.14 | 2,334.11 | 2,705.51 | 2,879.37 | 3,222.58 |
| Dallah Healthcare | 2,105.18 | 2,487.98 | 2,942.90 | 3,205.73 | 4,066.89 |
| Middle East Healthcare (Saudi German Health) | 1,872.62 | 2,151.74 | 2,653.17 | 2,882.82 | 3,102.63 |
| National Medical Care | 845.38 | 917.93 | 1,081.78 | 1,293.69 | 1,600.36 |
| Al Hammadi Holding | 951.89 | 1,122.40 | 1,176.76 | 1,153.88 | 1,234.53 |
| Almoosa Health | 701.54 | 816.04 | 978.97 | 1,202.34 | 1,416.28 |
| Fakeeh Care | 1,964.68 | 2,012.39 | 2,326.69 | 2,790.90 | 3,090.20 |
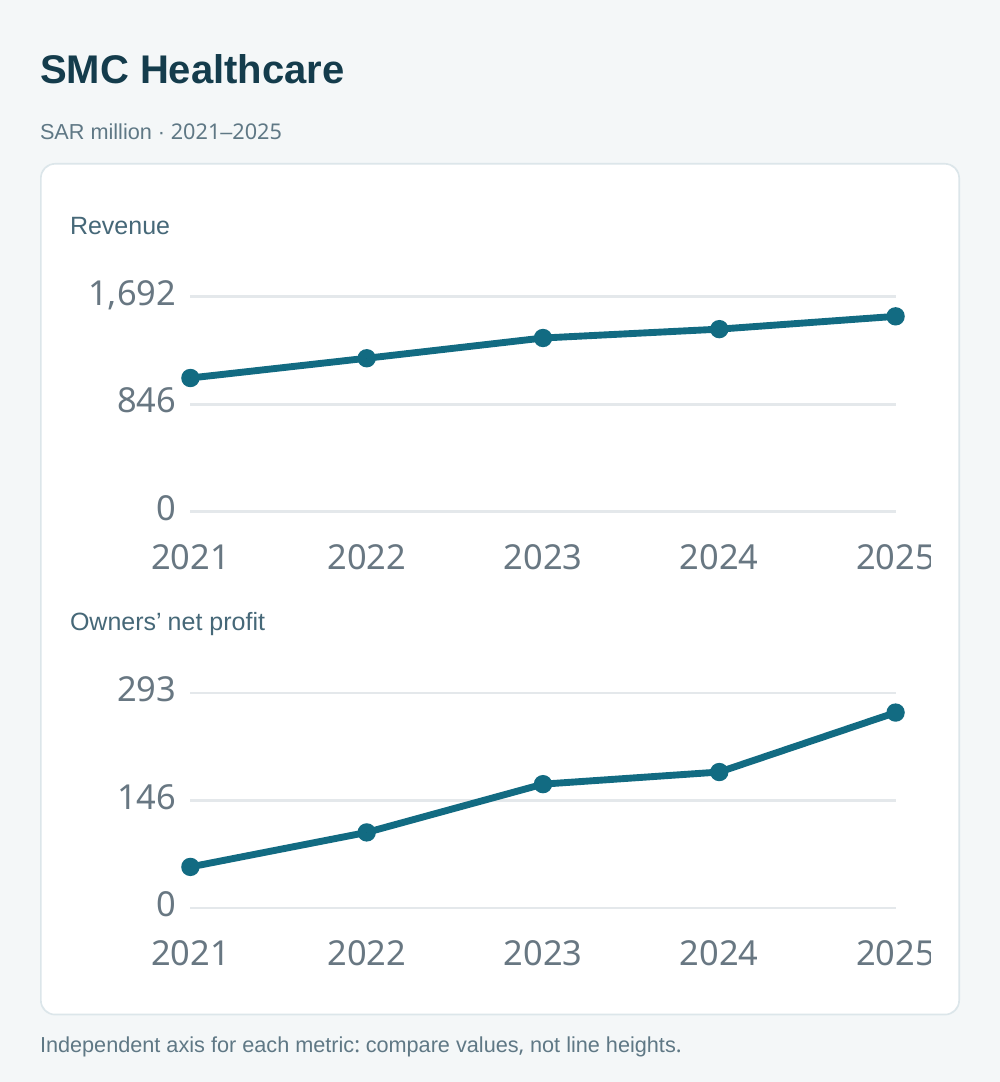
| SMC Healthcare | 1,053.12 | 1,208.65 | 1,367.93 | 1,437.80 | 1,538.50 |
Owners’ net profit — SAR million
| Company | 2021 | 2022 | 2023 | 2024 | 2025 |
|---|---|---|---|---|---|
| Dr. Sulaiman Al Habib Medical Services Group | 1,376.62 | 1,650.75 | 2,046.01 | 2,315.29 | 2,401.47 |
| Mouwasat Medical Services | 578.16 | 599.31 | 657.69 | 645.76 | 822.04 |
| Dallah Healthcare | 258.60 | 274.46 | 360.12 | 471.20 | 538.27 |
| Middle East Healthcare (Saudi German Health) | 17.20 | 75.18 | 17.04 | — | — |
| National Medical Care | 136.36 | 170.07 | 240.93 | 294.70 | 318.47 |
| Al Hammadi Holding | 90.09 | 257.34 | 303.33 | 338.80 | 241.86 |
| Almoosa Health | 62.42 | 51.02 | — | 49.35 | 236.54 |
| Fakeeh Care | 334.28 | 326.32 | 279.60 | 287.60 | 290.20 |
| SMC Healthcare | 55.97 | 102.96 | 168.70 | 185.20 | 266.20 |
Saudi German: comparable 2024 and 2025 profits are excluded pending reconciliation of restatements; revenue is retained as historical annual disclosure. Almoosa’s 2023 profit cannot be reconciled from available evidence. Missing values are excluded from profit rankings and margins.
Pharmacy retail: higher sales can carry a higher cost to serve
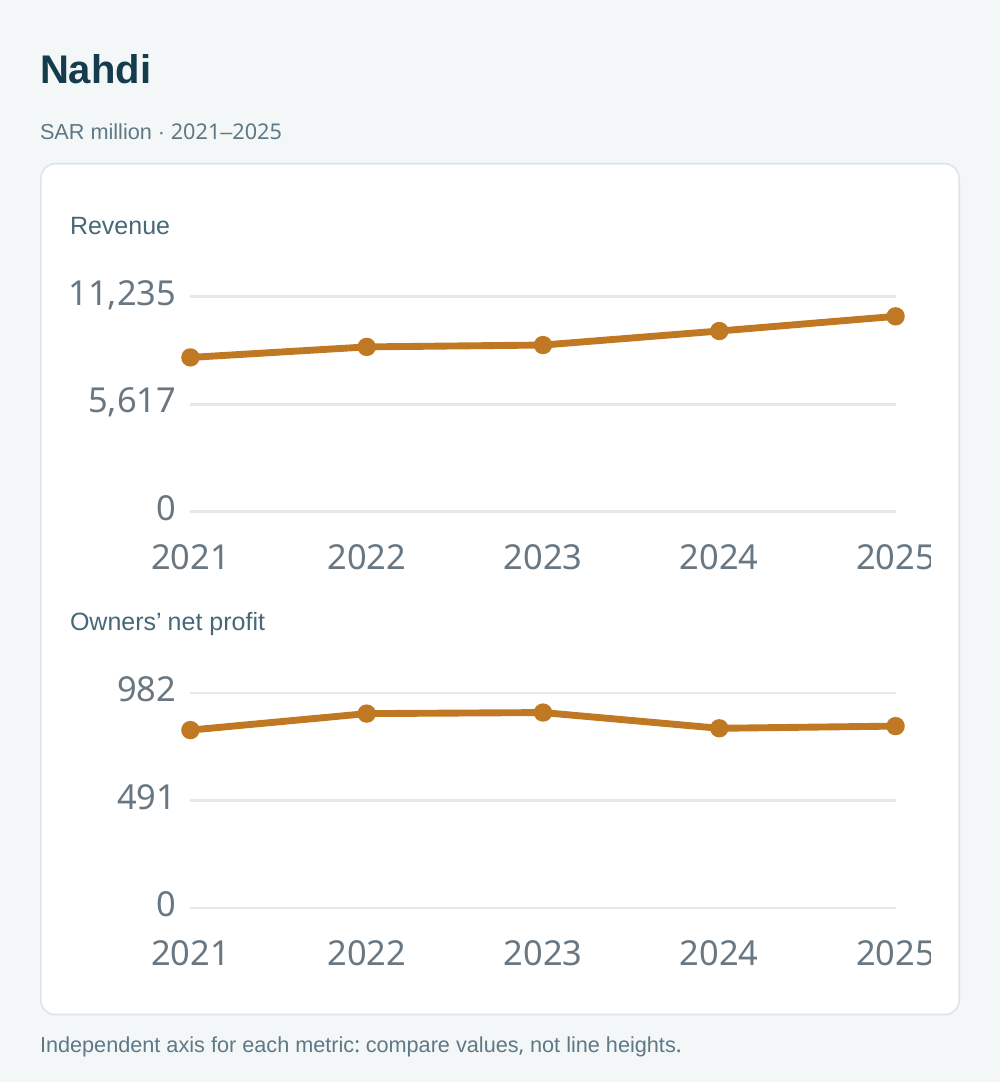
Nahdi’s revenue increased from SAR 8,066.22 million in 2021 to SAR 10,213.24 million in 2025. Reported net profit moved from SAR 812.53 million to SAR 830.74 million over the same endpoints, reaching SAR 892.6 million in 2023 before declining in 2024. Expansion in retail, healthcare and the UAE supported revenue, while new locations, digitalization and other operating investments increased costs. The 2025 result also benefited from a SAR 17.8 million zakat release. Sources: 2021 result, 2025 result.
For pharmacy management, the issue is not simply whether online orders or branch sales are growing. The relevant unit economics include product margin, promotional funding, picking and delivery costs, payment charges, returns and the cost of maintaining customer service. An order can add revenue while making a smaller contribution than an in-store purchase. Conversely, a digital channel may improve convenience and retention even before its standalone economics mature. Both possibilities require measurement rather than assumption.
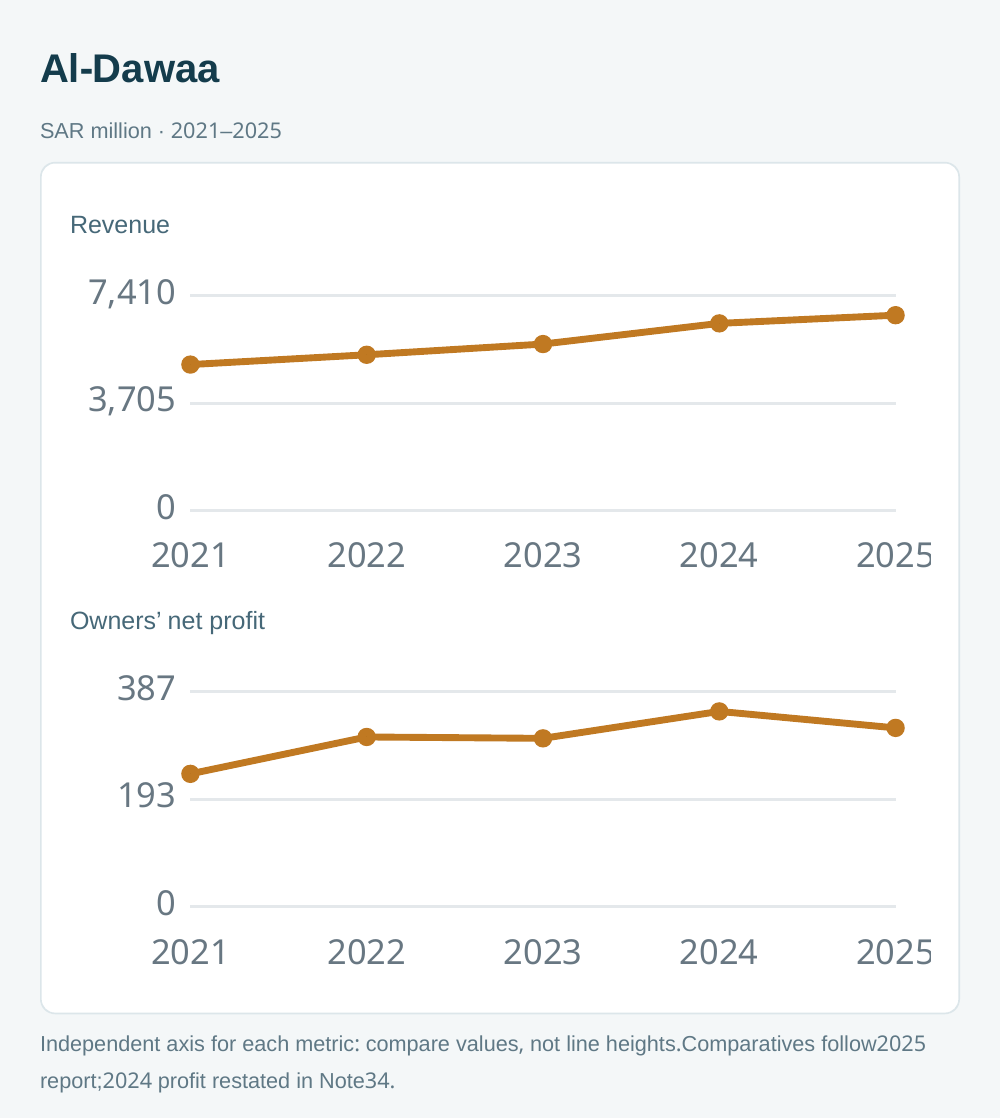
Al-Dawaa’s 2025 annual report gives revenue of SAR 5,034.382 million in 2021 and SAR 6,736.196 million in 2025, with reported net profit of SAR 239.145 million and SAR 321.756 million respectively. Its five-year table presents 2023 profit of SAR 302.992 million and 2024 profit of SAR 351.408 million, which differ from original announcements. The audited 2025 financial statements identify IAS 8 corrections. For 2024, these include end-of-service benefit attribution, bonus accruals, residency-permit costs and logistics revenue timing. The latest comparative is therefore used rather than the original announcement. The separate 2023 revised value is supported by the five-year table, although the same note does not provide a standalone 2023 income bridge. Sources: Al-Dawaa 2025 annual report, five-year table, audited statements, Note 34.
In 2025, retail, distribution and logistics all supported Al-Dawaa’s revenue, while selling and distribution expenditure increased with branch, digital and logistics investments. This suggests a more useful commercial scorecard than sales alone: contribution by channel, availability of essential products, fulfillment reliability, repeat purchases and the performance of each expansion cohort. These are proposed management measures, not claims that the company currently reports all of them.
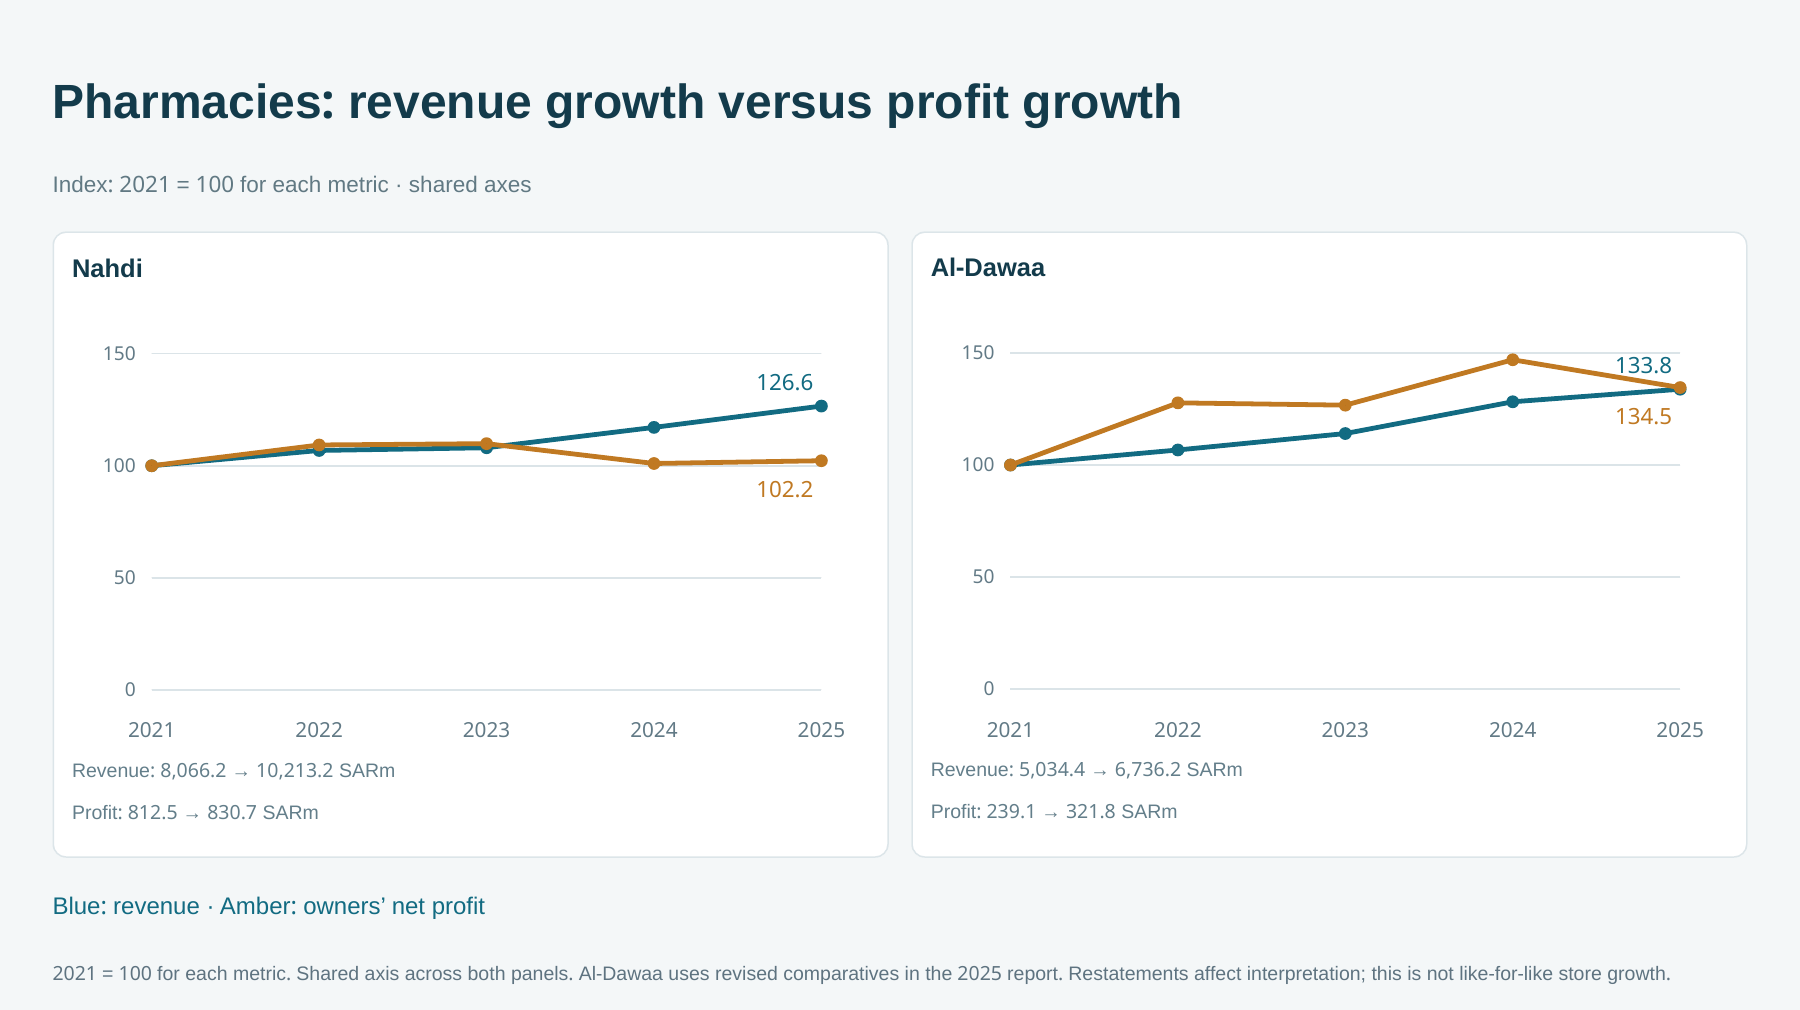
2021 = 100 for each metric. Shared axis across both panels. Al-Dawaa uses revised comparatives in the 2025 report. Restatements affect interpretation; this is not like-for-like store growth.
Pharmacy retailers
Revenue — SAR million
| Company | 2021 | 2022 | 2023 | 2024 | 2025 |
|---|---|---|---|---|---|
| Nahdi | 8,066.22 | 8,616.20 | 8,713.70 | 9,446.42 | 10,213.24 |
| Al-Dawaa | 5,034.38 | 5,372.24 | 5,741.36 | 6,454.35 | 6,736.20 |
Owners’ net profit — SAR million
| Company | 2021 | 2022 | 2023 | 2024 | 2025 |
|---|---|---|---|---|---|
| Nahdi | 812.53 | 887.80 | 892.60 | 820.72 | 830.74 |
| Al-Dawaa | 239.15 | 305.45 | 302.99 | 351.41 | 321.76 |
Manufacturing-led pharmaceutical groups: mix and execution matter as much as volume
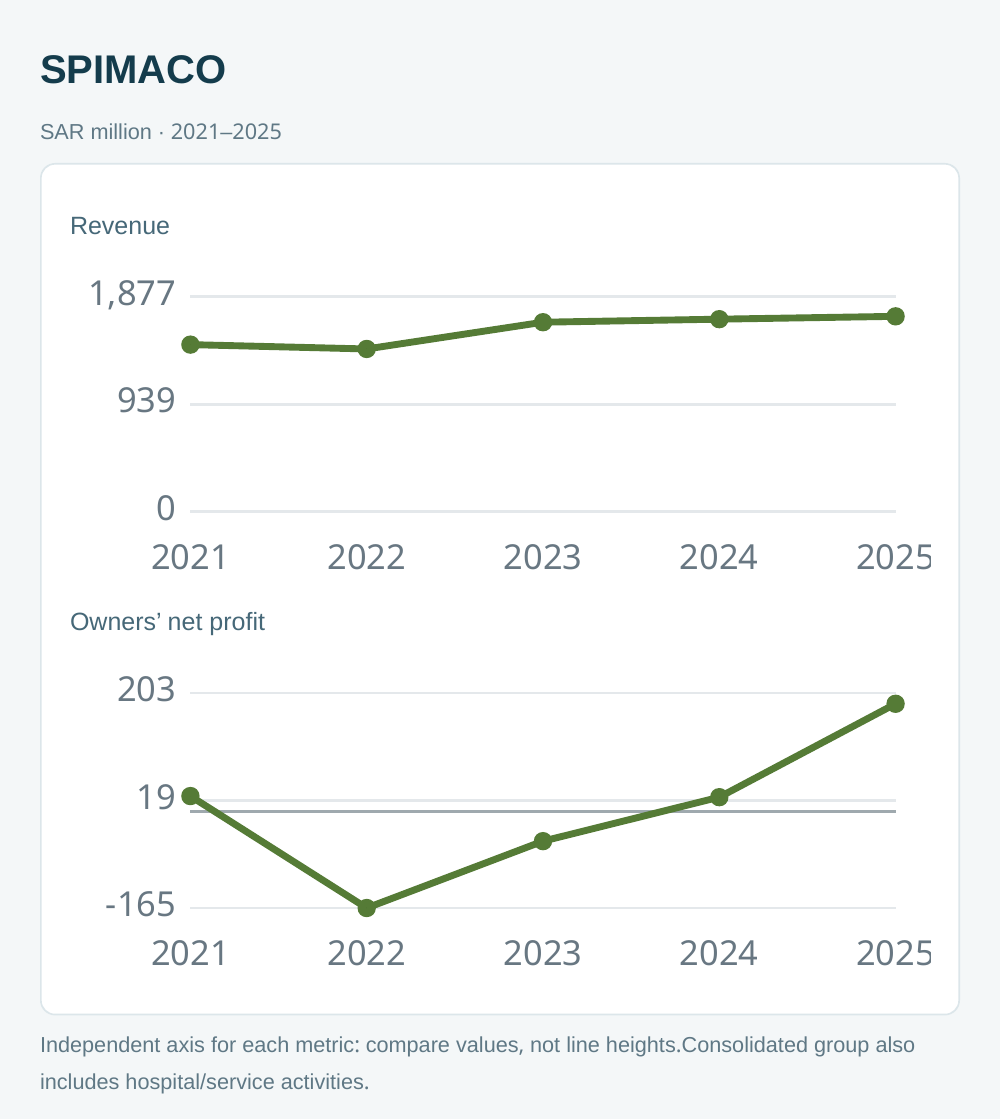
SPIMACO’s series captures a turnaround with substantial volatility. Revenue was SAR 1,459.78 million in 2021, SAR 1,421.81 million in 2022, SAR 1,655.44 million in 2023, SAR 1,682 million in 2024 and SAR 1,706.71 million in 2025. Owner-attributable profit was SAR 26.45 million, a loss of SAR 165.14 million, a loss of SAR 50.73 million, profit of SAR 24.54 million and profit of SAR 184.36 million respectively. These are owner-attributable figures, not the higher or lower total group profits that can appear elsewhere. Sources: historical comparison, 2024 result, 2025 result.
The 2022 annual report described pricing pressure and the loss of sales from a licensed product, despite increased pack volumes. The later recovery included changes in customer and product mix, cost control and the discontinuation of low-margin contracts. In 2025, lower selling, administrative and impairment expenses, together with higher other income, supported a much larger profit improvement than the revenue movement alone would suggest. Sources: 2022 annual report, 2025 earnings release.
The commercial lesson is that volume is incomplete without price, mix and cost to serve. A manufacturer can sell more packs while generating weaker value sales. Management should examine contribution by product and customer, contractual obligations, manufacturing constraints and collection risk. Marketing can support clearer product positioning and better demand planning, but it cannot independently overcome an uneconomic contract or a production bottleneck.
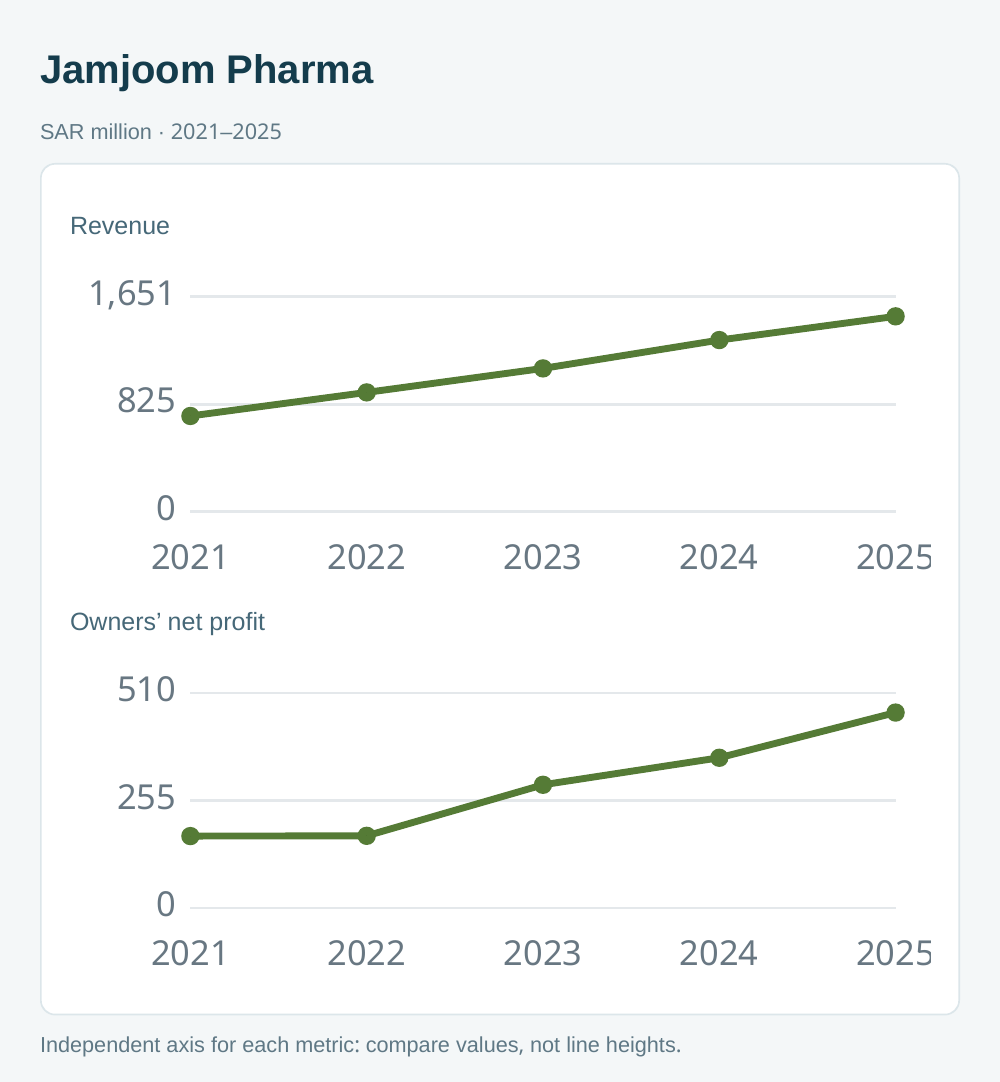
Jamjoom Pharma expanded revenue from SAR 735.68 million in 2021 to SAR 1,500.63 million in 2025, while owner-attributable profit rose from SAR 170.70 million to SAR 463.80 million. However, the path was not uniformly smooth. Revenue increased in 2022 while profit remained close to the previous year; the company’s IPO materials described significant currency-related losses. Later performance benefited from product mix, operating leverage and other contributions. Sources: historical series, IPO explanation, 2025 result.
This reinforces the need to separate commercial strength from external exposures. A regional expansion plan needs a currency and working-capital assessment alongside its market-access and promotion strategy. The right marketing decision may depend on distributor quality, credit terms, stock availability and the ability to maintain service, not just on the apparent size of the addressable audience.
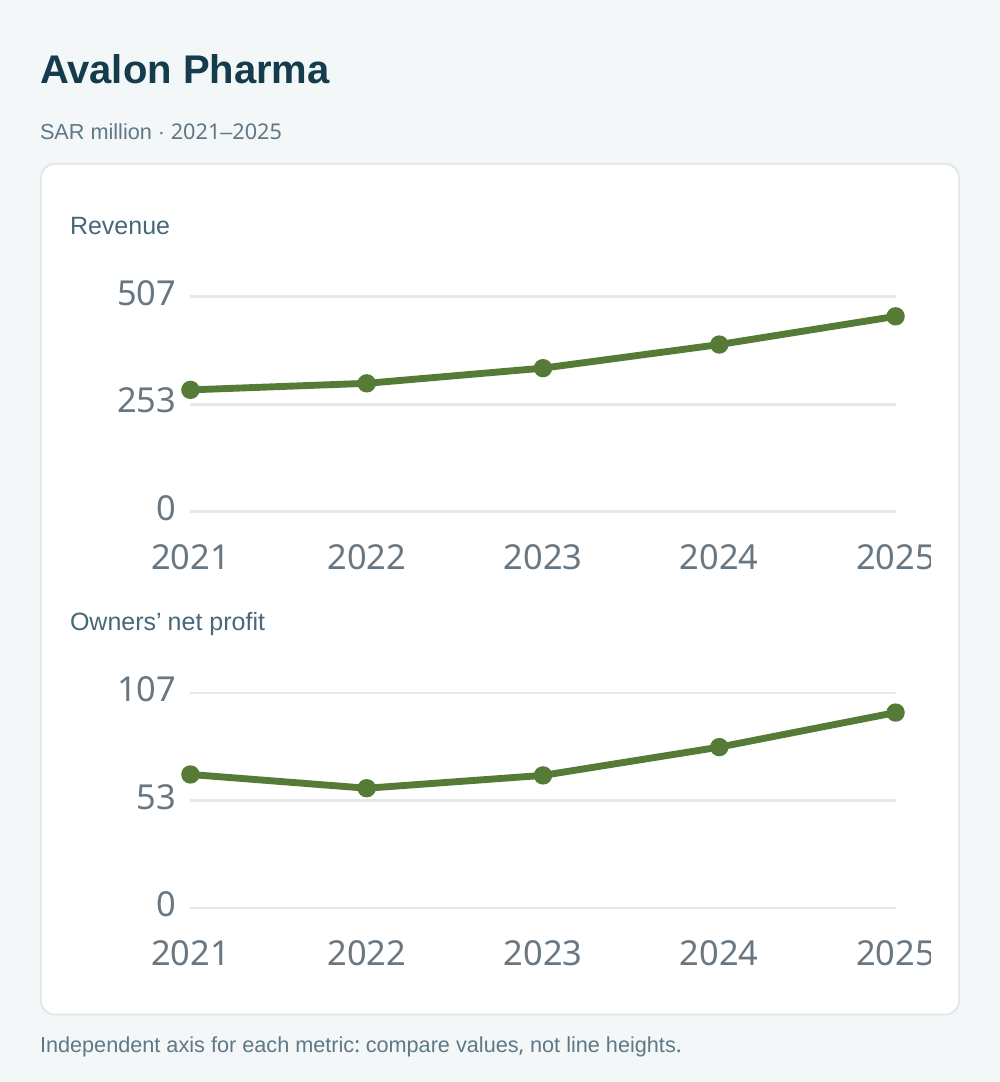
Avalon Pharma increased revenue from SAR 287.222 million in 2021 to SAR 460.49 million in 2025, while profit increased from SAR 66.283 million to SAR 97.01 million. Profit fell in 2022 even as revenue increased, demonstrating that a growing top line does not automatically cover higher operating and financial costs. By 2025, management cited private-sector agreements, government tenders and exports among the growth contributors, with favorable mix and scale supporting profitability. Sources: prospectus, 2025 annual result.
Jamjoom and Avalon have usable financial history from before listing. Those years should be identified as pre-IPO financial statements rather than left blank simply because the shares were not yet traded. SPIMACO, meanwhile, includes hospital and service activities in its consolidated group. Its total revenue should not be described as exclusively domestic drug-manufacturing revenue.
Manufacturing-led pharmaceutical groups
Revenue — SAR million
| Company | 2021 | 2022 | 2023 | 2024 | 2025 |
|---|---|---|---|---|---|
| SPIMACO | 1,459.78 | 1,421.81 | 1,655.44 | 1,682.00 | 1,706.71 |
| Jamjoom Pharma | 735.68 | 916.67 | 1,100.82 | 1,318.48 | 1,500.63 |
| Avalon Pharma | 287.22 | 302.66 | 338.44 | 394.00 | 460.49 |
Owners’ net profit — SAR million
| Company | 2021 | 2022 | 2023 | 2024 | 2025 |
|---|---|---|---|---|---|
| SPIMACO | 26.45 | -165.14 | -50.73 | 24.54 | 184.36 |
| Jamjoom Pharma | 170.70 | 171.31 | 292.40 | 356.52 | 463.80 |
| Avalon Pharma | 66.28 | 59.45 | 65.83 | 79.85 | 97.01 |
Smaller providers: do not let growth rates conceal the starting point
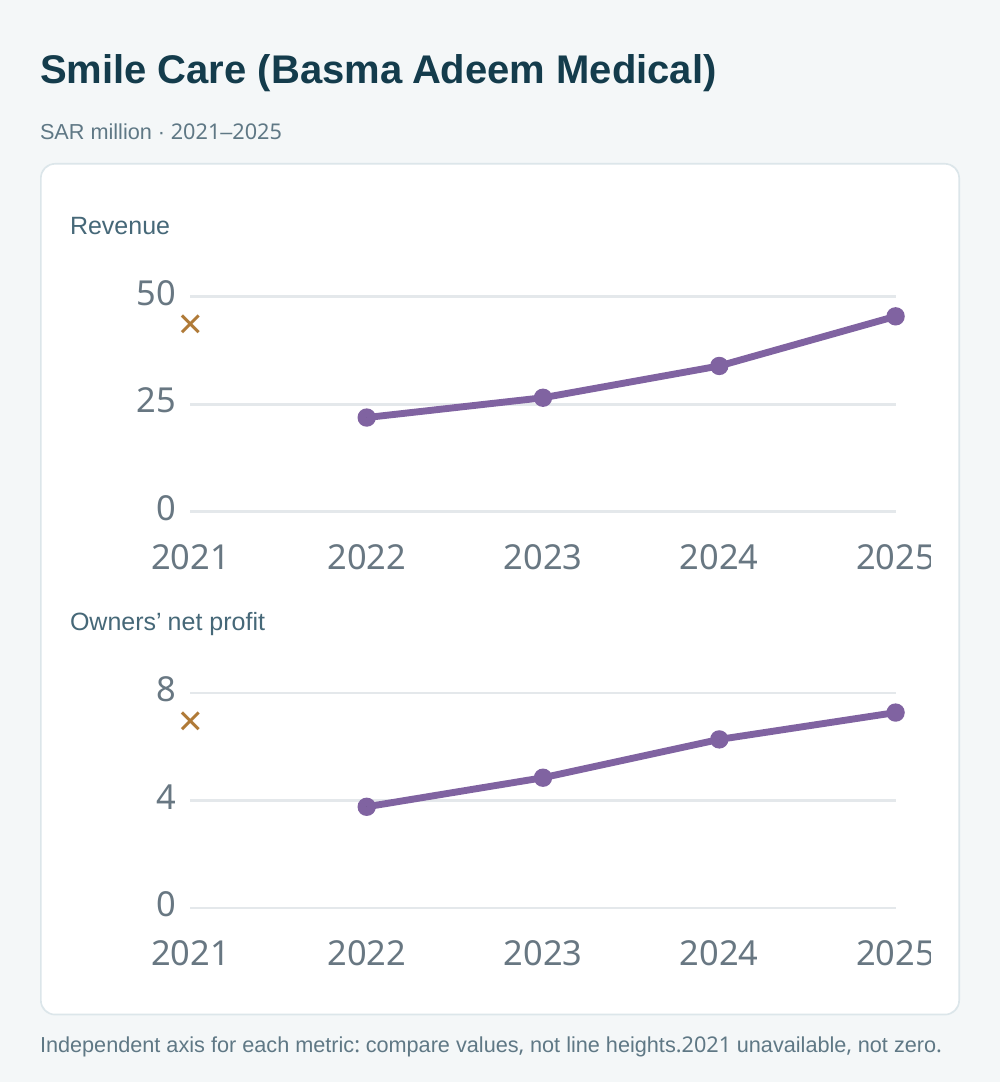
The smaller-provider panel adds useful context without pretending to represent every clinic. Smile Care, legally Basma Adeem Medical, reported revenue of SAR 21.922 million in 2022 and SAR 45.457 million in 2025, with profit of SAR 3.783 million and SAR 7.305 million respectively. No verified 2021 annual value was located in the prospectus reviewed. The correct presentation is a visible gap, not a zero or an invented estimate. Sources: prospectus, 2025 announcement.
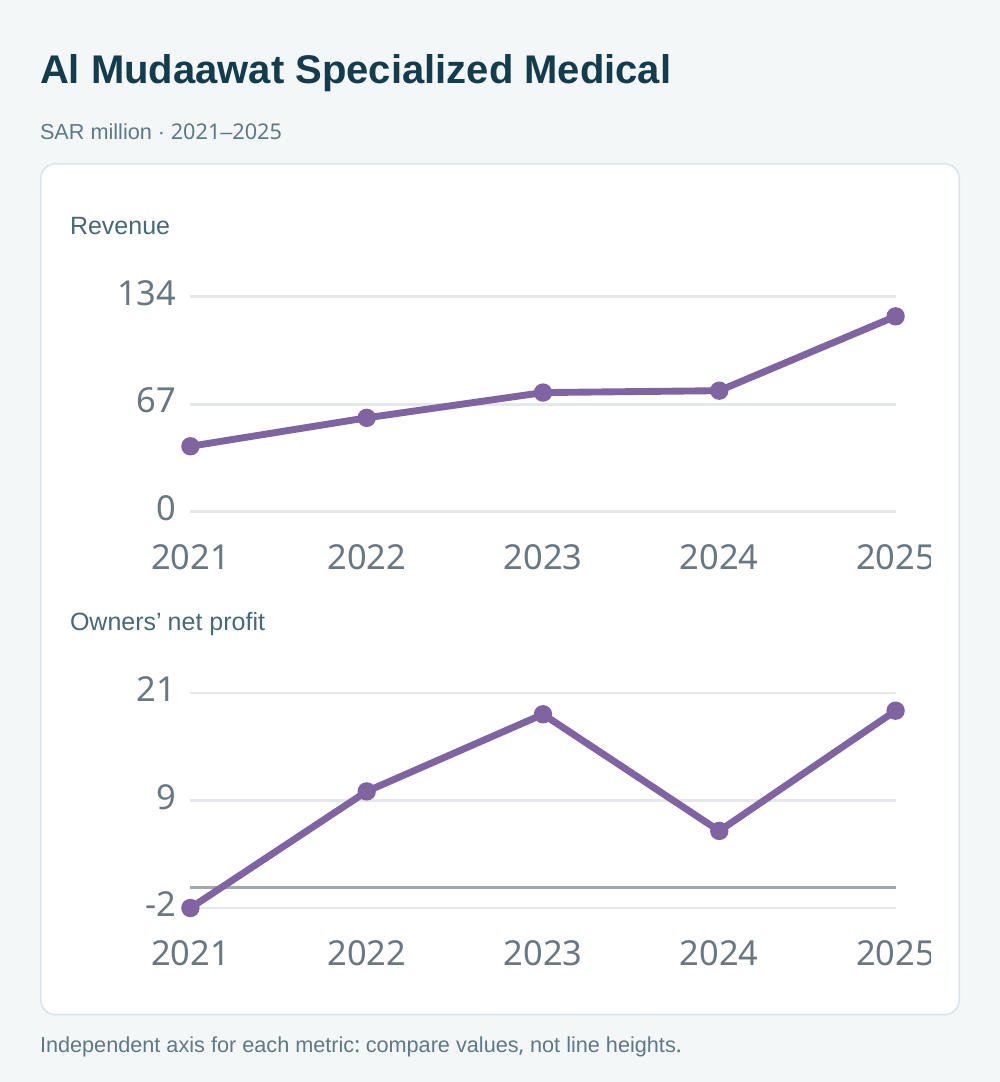
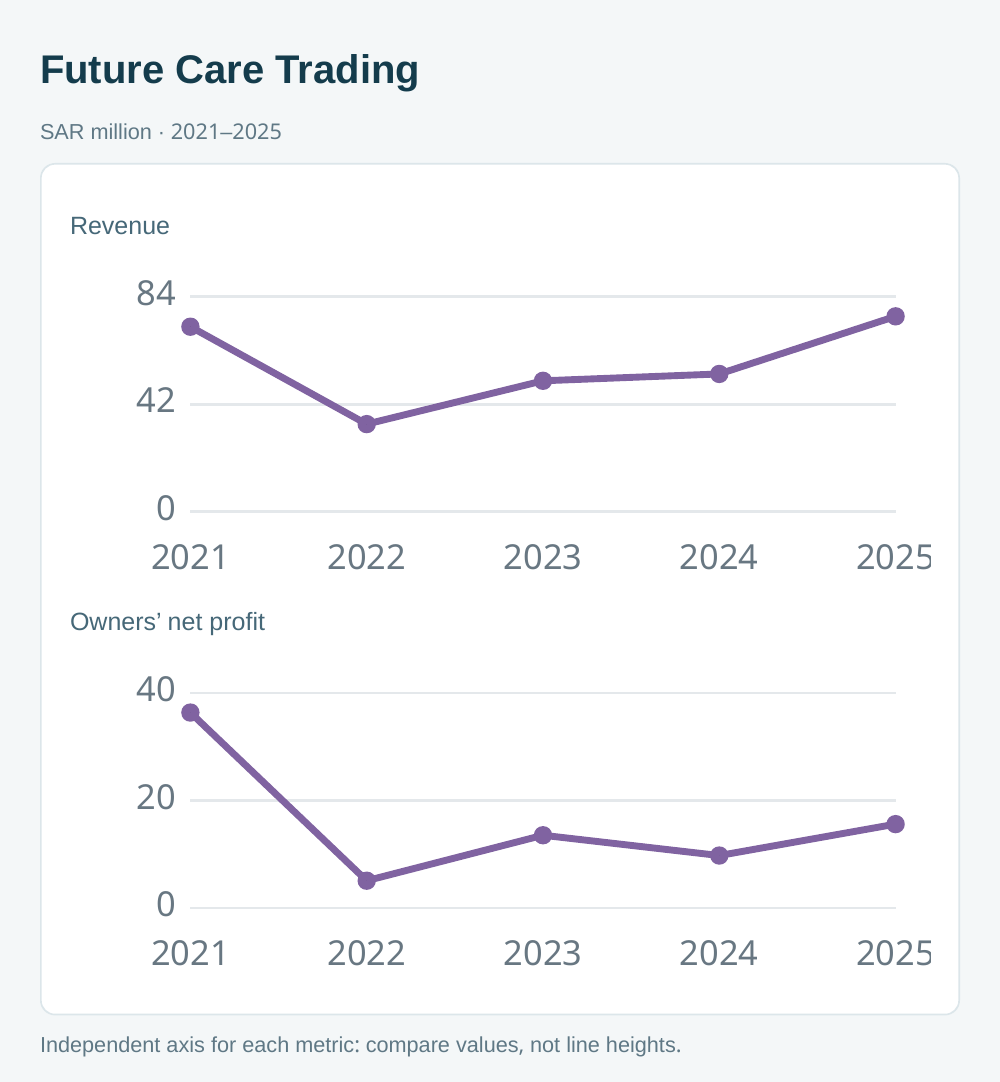
Al Mudaawat increased revenue from approximately SAR 40.837 million in 2021 to SAR 121.821 million in 2025. Its result moved from a reported loss of approximately SAR 2.2 million in 2021 to profit of SAR 18.975 million in 2025, but profit had fallen sharply in 2024 before recovering. Future Care likewise had a markedly stronger profit baseline in 2021 than in 2022. These patterns make percentage growth particularly sensitive to the selected starting year. Sources: Al Mudaawat financial statements, 2021 rounded loss, 2025 result, Future Care 2022 comparison.
A smaller provider should therefore be assessed through several lenses: the absolute revenue base, repeatable demand, physician and service capacity, the reliability of referral sources and the costs of expansion. The financial statements do not establish the performance of a particular campaign. They identify questions that a campaign analysis must answer with operational evidence.
No reliable public annual 2021–2025 revenue and net-profit series was located for the Saudi Al Borg laboratory network. Another company with a similar name in a different country must not be substituted. A transparent exclusion is more useful than false completeness. Source for Saudi Al Borg identity.
Smaller healthcare providers
Revenue — SAR million
| Company | 2021 | 2022 | 2023 | 2024 | 2025 |
|---|---|---|---|---|---|
| Smile Care (Basma Adeem Medical) | — | 21.92 | 26.52 | 33.92 | 45.46 |
| Al Mudaawat Specialized Medical | 40.84 | 58.57 | 74.31 | 75.49 | 121.82 |
| Future Care Trading | 72.03 | 34.12 | 50.98 | 53.64 | 76.06 |
Owners’ net profit — SAR million
| Company | 2021 | 2022 | 2023 | 2024 | 2025 |
|---|---|---|---|---|---|
| Smile Care (Basma Adeem Medical) | — | 3.78 | 4.87 | 6.30 | 7.30 |
| Al Mudaawat Specialized Medical | -2.20 | 10.31 | 18.59 | 6.07 | 18.98 |
| Future Care Trading | 36.70 | 5.13 | 13.66 | 9.85 | 15.75 |
Equipment and operations
Revenue — SAR million
| Company | 2021 | 2022 | 2023 | 2024 | 2025 |
|---|---|---|---|---|---|
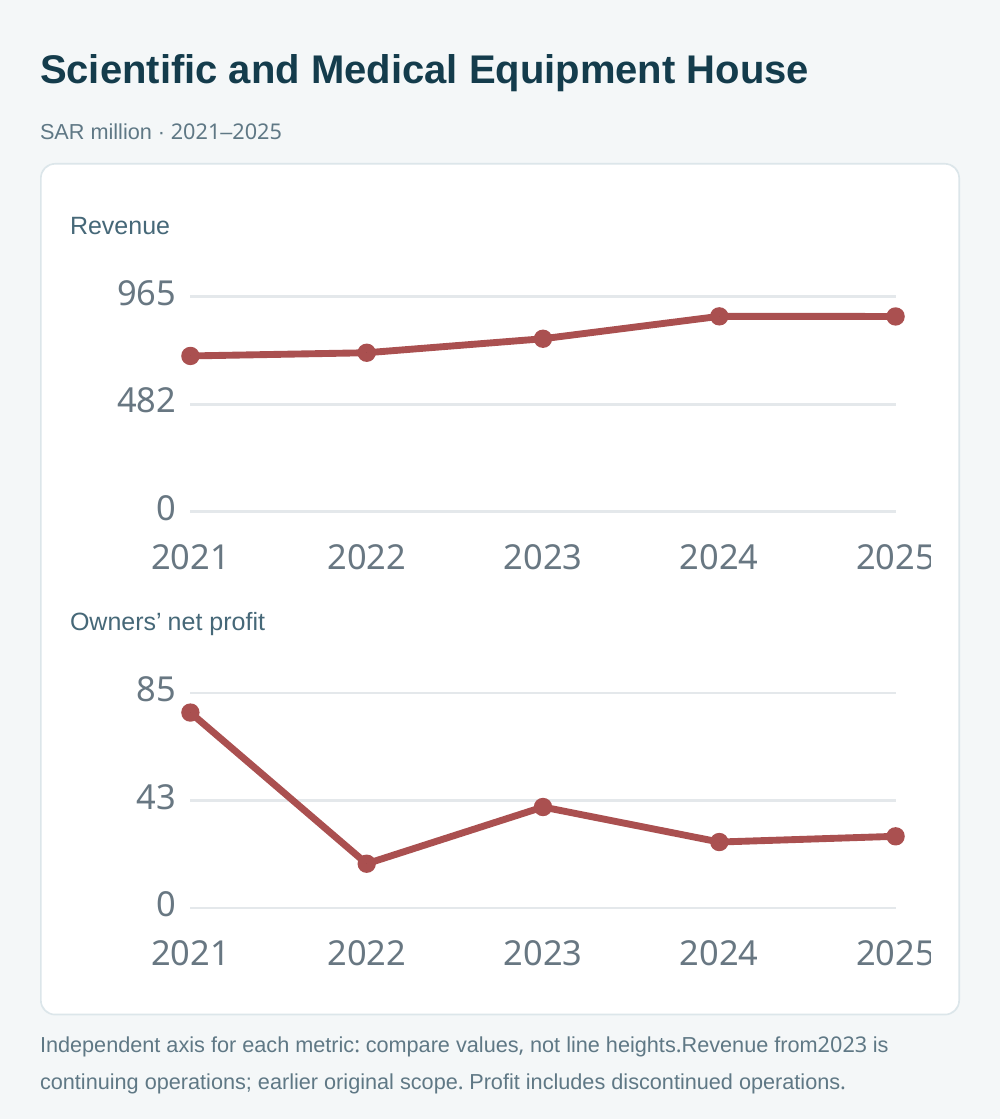
| Scientific and Medical Equipment House | 699.45 | 713.82 | 776.67 | 877.23 | 876.71 |
Owners’ net profit — SAR million
| Company | 2021 | 2022 | 2023 | 2024 | 2025 |
|---|---|---|---|---|---|
| Scientific and Medical Equipment House | 77.52 | 17.57 | 40.06 | 26.17 | 28.44 |
Equipment House: revenue from 2023 covers continuing operations; earlier years use original scope. A strict five-year CAGR is inappropriate across this change. Profit may include discontinued operations, so dividing it by continuing revenue does not produce a comparable operating margin.
Newly listed groups broaden the picture, but accounting still matters
Almoosa Health increased revenue from SAR 701.542 million in 2021 to SAR 1,416.285 million in 2025. The latest audited profit figures for 2024 and 2025 are SAR 49.353 million and SAR 236.541 million. However, derivative-accounting effects materially changed both years. The audited income statement and Note 18 show a SAR 36.200903 million derivative gain in 2025; Note 35 explains the SAR 45.070604 million derivative loss added to the corrected 2024 comparison. The resulting SAR 81.271507 million year-on-year swing equals approximately 43.4% of the SAR 187.188028 million reported profit increase, calculated from those disclosed amounts. This is an arithmetic explanation of a component of the change, not an independently audited recurring-profit measure. The effect therefore extends beyond a lower prior-year baseline; the current year also contains a positive derivative contribution. Financing movements further affect the interpretation. The original 2023 profit remains in a five-year board table while a different later figure appears in secondary coverage. Without a verified primary reconciliation, this article leaves comparable 2023 profit blank and does not calculate a five-year profit growth rate. Earlier original figures are not claimed to have been fully restated retrospectively. Sources: 2025 annual report and correction note, 2025 audited financial statements.
Fakeeh Care increased revenue from SAR 1,964.684 million in 2021 to SAR 3,090.2 million in 2025, while owner-attributable profit moved from SAR 334.282 million to SAR 290.2 million. New facilities and their development costs help explain why these endpoints move differently. Its 2025 earnings release shows declining operating profit alongside lower financing costs, leaving owner-attributable profit nearly flat. Total group profit was lower than owner-attributable profit because non-controlling interests absorbed losses. Using one measure for an earlier year and another for the later year would create an artificial trend. Sources: Fakeeh prospectus, 2025 earnings release.
SMC Healthcare reported revenue of SAR 1,053.124 million in 2021 and SAR 1,538.5 million in 2025, with profit of SAR 55.967 million and SAR 266.2 million respectively. The latest year included a SAR 60.6 million non-recurring land-related gain. Service mix and efficiency deserve attention, but the entire reported profit increase cannot be assigned to them. Simply subtracting the gain does not automatically produce an audited recurring net-profit figure, since associated tax and accounting effects require review. Sources: SMC prospectus, 2025 results.
Scientific and Medical Equipment House adds a supplier and operating-services perspective. Owner-attributable profit was SAR 77.524 million in 2021, SAR 17.567 million in 2022, SAR 40.059 million in 2023, SAR 26.168 million in 2024 and SAR 28.439 million in 2025. The reconciliation distinguishes owners’ profit from total group profit and includes discontinued operations. Revenue from 2023 onward is presented on a continuing-operations basis, whereas the earlier years use the original consolidated basis. A strict five-year revenue growth rate or an unqualified margin comparison would therefore be misleading. Sources: historical annual report, 2024 audited statements, 2025 issuer release.
Turning the evidence into an operating and marketing plan
The first management priority is a common definition of performance. Finance, operations and marketing should agree on what counts as a new patient, an attended visit, an accepted claim and collected revenue. A lead is an expression of interest; it is not yet a clinical encounter or a cash receipt. A dashboard that confuses these stages can make a campaign look efficient while the business carries cancellations, rejected claims or uncollected balances.
The second priority is matching demand to capacity. Marketing plans should be informed by appointment availability, staffing, equipment readiness and the services a location can reliably provide. When a facility is still developing, geographically focused awareness and appropriate referral relationships may be more useful than a broad campaign. When access is already constrained, improving scheduling and patient information may be more valuable than purchasing additional demand.
The third priority is evaluating the complete patient journey. Relevant measures can include inquiry-to-booking conversion, booking-to-attendance conversion, waiting time, follow-up completion and patient feedback. The purpose is to remove avoidable friction and support clinically appropriate care. These measures should not encourage unnecessary treatment, misleading clinical claims or the targeting of people through sensitive health information without appropriate permission.
The fourth priority is connecting marketing to financial contribution. Channel cost should be evaluated alongside the service delivered, payer arrangements and the cost to serve. Comparisons must respect differences between specialties and case complexity. A low-cost inquiry source may produce few attended appointments, while a more expensive educational channel may generate more appropriate demand. Neither outcome should be assumed without traceable evidence.
The fifth priority is disciplined expansion review. For a hospital, pharmacy branch or new service, distinguish opening costs from mature operating performance. Compare facilities at similar development stages, document changes in scope and keep acquisition effects separate. Management should be able to explain whether growth reflects more existing patients served, a new location, a new contract, a price or mix change, or a one-off financial item.
Finally, manage financial pressure with precision. Lower profit, a loss or a rising impairment charge can justify closer investigation, but it does not by itself prove insolvency. Liquidity, debt maturities, cash flows, covenant terms and available funding would need separate examination. The responsible commercial response is to diagnose the constraint, prioritize interventions and test them against observed outcomes, rather than promise that additional marketing will solve every financial problem.
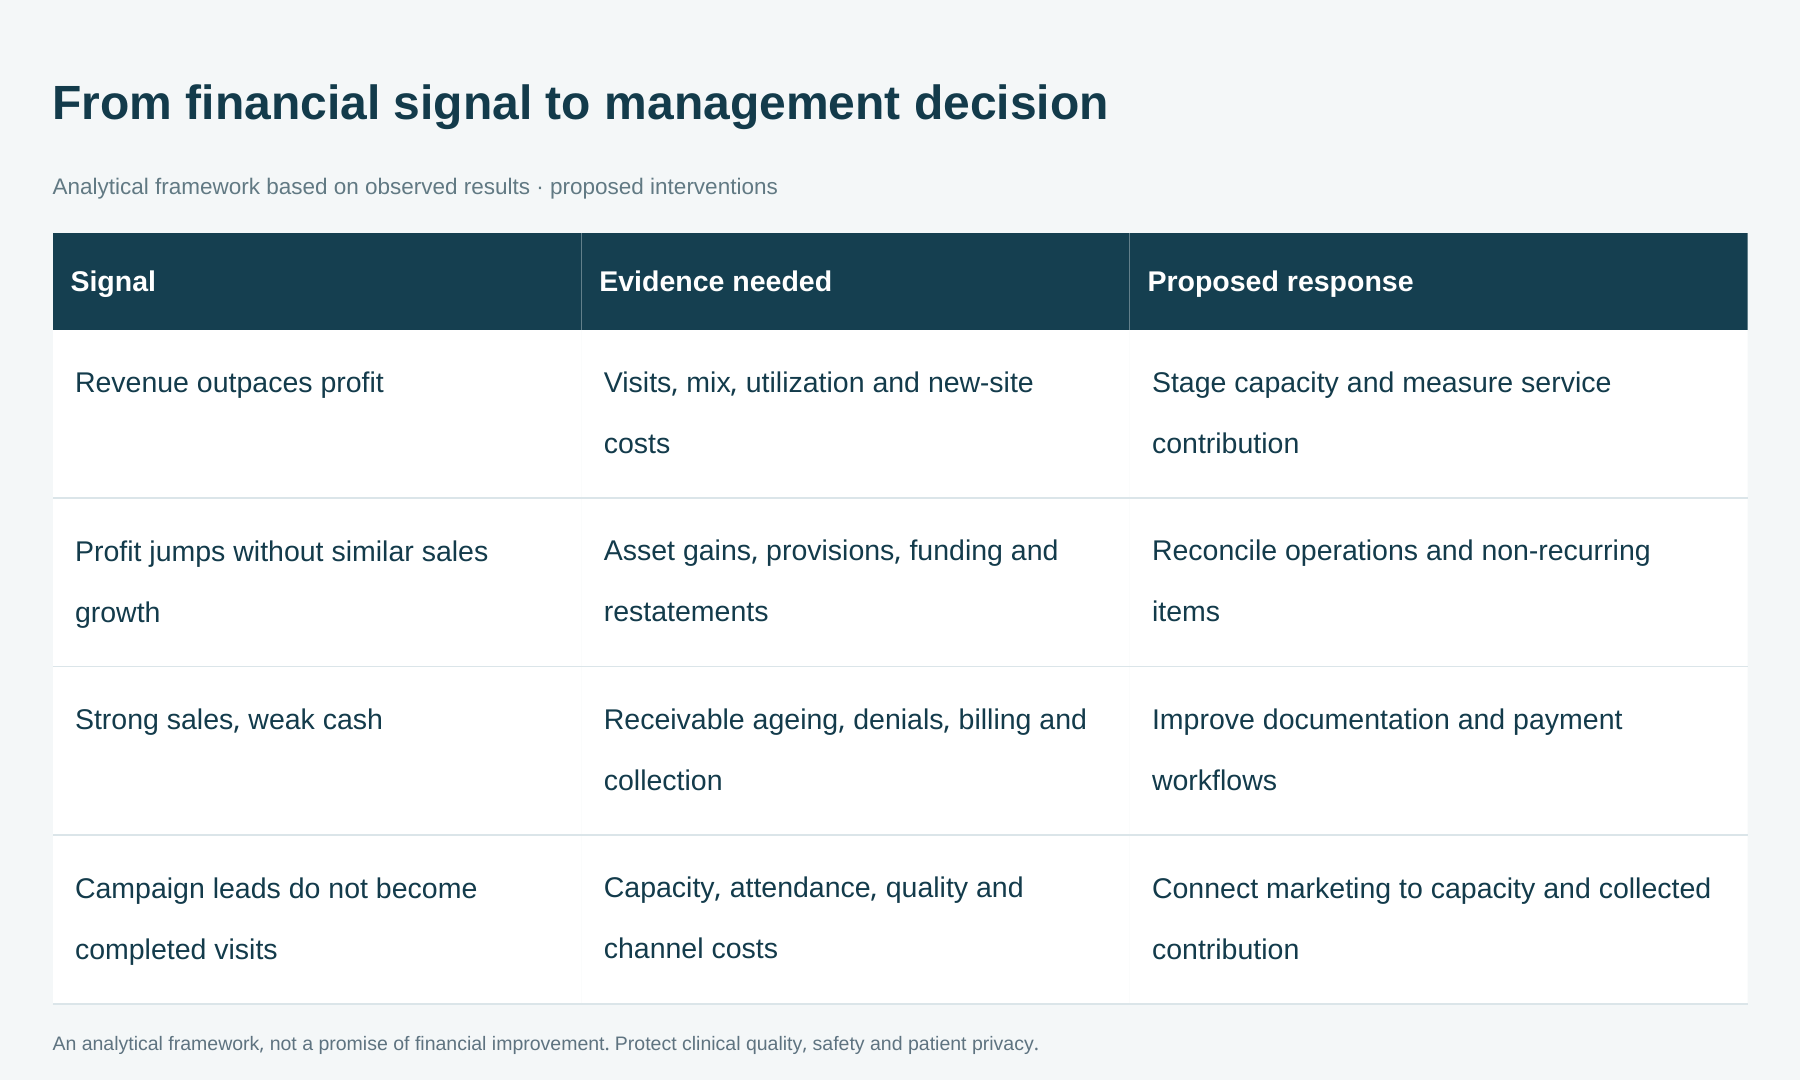
An analytical framework, not a promise of financial improvement. Protect clinical quality, safety and patient privacy.
Conclusion: growth becomes valuable when it is understood
The selected companies demonstrate that Saudi healthcare growth has several distinct financial expressions. Some businesses expanded while absorbing the cost of new capacity. Others benefited from product mix, collections or cost control. Acquisitions, land gains, provision releases and revised comparatives changed the meaning of reported growth in several cases.
For executives, the useful question is therefore specific: which parts of growth are repeatable, which require time to mature, and which depend on factors outside day-to-day operations? For healthcare marketers, the opportunity is to connect credible communication and easier access to services that the organization can deliver well, while measuring the journey from interest through attendance and appropriate financial contribution.
A careful comparison does not produce a universal winner or a guaranteed growth formula. It produces better questions, clearer operating priorities and a more honest basis for deciding where management attention and marketing resources can make a difference.
Comments
No published comments yet.