
A digital marketing plan can be busy without being useful. A healthcare organization might publish appointment reminders, redesign its website, answer social comments, and buy search advertising in the same month. Each activity may be reasonable, yet the team can still struggle to explain what improved for the organization or the people using its services. More activity is not an objective. Neither is the installation of a new tool.
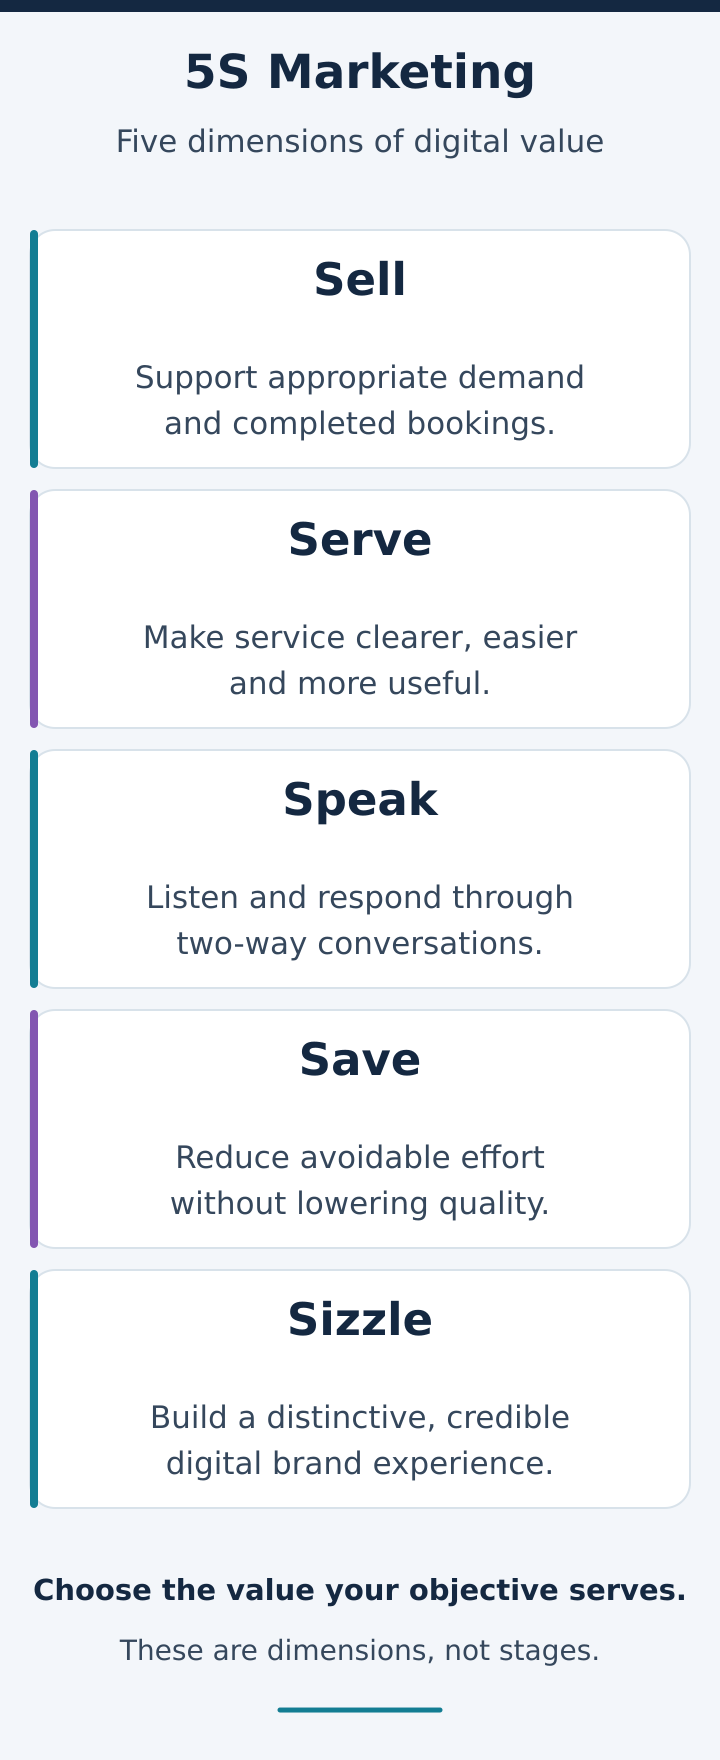
The 5S framework provides a practical way to name the value digital marketing should create. In the course’s treatment of PR Smith’s model, the five dimensions are Sell, Serve, Speak, Save, and Sizzle. They prompt a team to consider commercial contribution, added customer value, two-way dialogue, efficiency, and the digital brand experience. PR Smith’s own official planning guide identifies the same five dimensions in its objectives section and connects objective setting with SMART.
This article applies the course framework to healthcare administration and marketing. The organizations, budgets, volumes, targets, and results in the worked examples are entirely fictional. They illustrate planning and measurement, not predicted performance. The examples concern booking administration, information access, and customer support; they do not provide clinical guidance or suggest that marketing should influence a person’s medical decisions.
Understand what the five dimensions actually do
The 5S model is a set of objective categories. It is not a mandatory sequence through which a person must move. A visitor does not have to experience Sell before Serve, and an organization does not have to complete Speak before beginning Save. Several dimensions can operate at the same time. A clearer booking page might help people complete an administrative task, reduce repeated calls, and strengthen confidence in the organization’s reliability.
That overlap is useful, but it does not mean every activity automatically delivers all five benefits. A team must show how each claimed benefit would occur and what evidence would support it. If a page redesign is justified primarily by Serve, its central question is whether people can complete their task more successfully. Calling the same redesign Sizzle does not remove the need to investigate the experience or prove that the desired brand association became stronger.
The course makes another important distinction: 5S identifies the kind of value an objective should deliver, while SMART makes that objective sufficiently specific and measurable to manage. Its objectives criteria also require alignment with the organization’s wider purpose and justification from the situation analysis. An objective should therefore connect three things: a real organizational need, at least one S, and a credible measurement plan. A precise numerical target can still be the wrong target when it rewards behavior the organization should not encourage.
For a healthcare organization, this matters particularly when commercial goals meet access, capacity, and public trust. An increase in enquiries has little value if the administrative team cannot respond, information is misleading, or people are directed toward an unsuitable service. The framework helps surface these tensions. It does not decide them automatically or replace professional, operational, privacy, or legal review where those reviews are needed.
For the preceding lesson, see SMART marketing objectives.
Sell: connect digital activity with a justified commercial outcome
Sell concerns the commercial contribution of digital marketing. The course explicitly includes both transactions completed online and offline transactions influenced by digital channels. A useful website can contribute to a later telephone booking even when the final action happens away from the website. Conversely, a rise in online bookings may simply reflect people switching from telephone to web rather than an increase in total demand.
Start by naming the business outcome and the unit being counted. An enquiry, a submitted booking request, a confirmed appointment, and recognized revenue are different events. Do not describe them interchangeably. A healthcare marketing team might choose confirmed bookings for an existing administrative booking service as an operational conversion measure. It should still explain that a confirmation is not evidence of attendance, revenue, clinical appropriateness, or improved health.
Then define the relevant denominator. Booking completion rate could mean confirmed bookings divided by eligible booking-flow sessions, or confirmed bookings divided by all website sessions. Both calculations can be useful, but they answer different questions. The first examines the booking process; the second blends traffic quality with process performance. A report should state which definition it uses and keep it consistent across comparison periods.
Attribution also needs restraint. A person may see an advertisement, read several pages, speak with a receptionist, and return directly before booking. Counting the same outcome as a full success for every channel exaggerates performance. A practical reporting approach is to separate directly recorded digital conversions from self-reported or otherwise supported digital influence, identify the attribution window, and disclose missing information. Where possible, use controlled comparisons to investigate incremental effects rather than treating every attributed conversion as caused by marketing.
A sound Sell objective also needs operational boundaries. Available appointment capacity, response times, cancellation handling, and accurate service descriptions can limit what a campaign should promote. If the organization cannot support more demand responsibly, improving the quality of information or the routing of existing enquiries may be more valuable than increasing volume. Commercial contribution should be judged within the service the organization can actually deliver.
Serve: add value by helping people accomplish something
Serve asks what additional value the digital experience gives the person using it. In healthcare administration, this might mean finding the correct entrance, understanding how to request an appointment change, locating an accessible contact option, or receiving a clear explanation of an administrative process. The value comes from making a useful task easier or more successful, not merely from adding another page or feature.
Begin with a task expressed in the user’s language. “Find out how to change my appointment” is more actionable than “engage with our patient experience content.” The first statement points toward information architecture, a clear route, understandable wording, and a successful completion event. The second can tempt the team to reward time on page even when that time reflects confusion.
Task success rate is one possible primary measure. Define it as successful task completions divided by observed or eligible task attempts, and explain how success is established. In a usability study, success can be observed directly. In live analytics, a page visit is usually an incomplete proxy. A feedback question, a reliable confirmation event, or a carefully designed follow-up sample may be needed to distinguish successful self-service from abandonment.
Serving people well also means recognizing different access needs. Plain language, usable mobile layouts, keyboard navigation, readable text, and alternatives to digital-only contact should be part of the design discussion. Test representative tasks with people who use different devices and support tools. An average improvement can hide a serious problem for a smaller group, especially if that group is underrepresented in the data.
Serve has a natural tension with Save. A short form may reduce staff effort but increase the work a person must do to explain an unusual situation. A comprehensive help page may answer common questions but overwhelm a first-time visitor. Good planning makes these tensions explicit and keeps a visible human escalation route. Efficiency is valuable only when the task still works for the people who need it.
Speak: create a dialogue that changes decisions
Speak concerns getting closer to people through two-way communication, listening, and learning. The course includes examples such as live chat, surveys, and social listening. Publishing frequently is not enough. A team practicing Speak must be able to explain what it wants to learn, how it will respond, and which organizational decisions the conversation can influence.
For an administrative service, a useful question might be why visitors abandon an appointment-change form. A short optional survey, structured feedback from reception staff, and a small number of usability conversations can reveal different parts of the problem. The survey may identify a confusing field, while staff may know that people are uncertain which location they selected. Neither source should be treated as a complete picture on its own.
Response rate requires an explicit denominator: the number of valid responses divided by the number of eligible invitations successfully presented or delivered. Define what counts as a valid response and report the sample size. People who choose to answer are often different from those who do not. A high satisfaction score from a small self-selected sample should not be described as the opinion of every patient or visitor.
Conversation quality matters alongside response speed. A fast acknowledgement is useful, but it is not the same as resolving a question. Separate first-response time from resolution time, and distinguish automated acknowledgements from substantive human replies. Classify recurring administrative themes and assign an owner who can investigate them. Otherwise, the organization collects feedback without creating any route from listening to improvement.
Privacy should shape the channel design. Public comments and ordinary marketing forms are poor places to invite medical details, account information, or other sensitive disclosures. Ask bounded questions about navigation and administrative experience, explain the channel’s purpose, and redirect personal matters to the organization’s appropriate secure route. A useful feedback loop can often operate with aggregated themes instead of retaining identifiable stories.
Save: measure net efficiency without moving the burden
Save concerns reducing unnecessary cost or effort. The course discusses digital communication, self-service, and automation as possible mechanisms. The objective is the resource improvement, however, rather than the presence of automation. A new chatbot that creates additional escalations may add work even if it appears to handle many conversations.
The starting point should be a process with a known baseline. Measure how long it takes to resolve a comparable administrative request, including preparation and follow-up where relevant. Multiplying the difference in average handling time by the number of comparable requests provides an estimate of gross staff time released. It does not yet establish net savings, cash savings, or better service.
Net effort must include the work introduced elsewhere. Content maintenance, software administration, training, quality checks, failed interactions, and escalated cases can absorb much of the apparent gain. Some costs occur only during implementation, while others recur. Keep those categories separate so a first-month result does not conceal the likely ongoing burden or exaggerate it.
Also distinguish capacity from money. If staff use released time to handle a backlog, the organization may gain useful capacity without reducing payroll. Multiplying hours by an assumed hourly cost can illustrate a notional value, but it does not prove that the budget fell by that amount. A financial saving requires a corresponding change in actual expenditure or another clearly stated accounting treatment.
The person using the service has a workload too. If a digital process saves an employee two minutes but makes a visitor repeat information three times, the overall experience may deteriorate. Track repeat contacts, unresolved requests, abandonment, and escalation quality alongside internal efficiency. A process that suppresses calls by making the telephone number harder to find has not necessarily saved anything of value.
Sizzle: make the brand promise visible in the experience
Sizzle concerns strengthening and extending the brand through its digital presence, experiences, and communities. In healthcare administration, this does not require spectacle. A calm, consistent, understandable experience can express a valuable brand promise more convincingly than a visually dramatic website that makes routine tasks difficult.
Define the association the organization wants to earn. For example, it may want people to recognize the administrative service as clear, responsive, and easy to navigate. Those associations should be supported by visible evidence: consistent location details, understandable contact choices, helpful confirmation messages, and an honest explanation of what happens next. Design and content should reinforce the same promise.
Brand measurement needs more than traffic or follower counts. A survey can ask whether respondents associate the organization with a defined quality, provided the question, sample approach, and timing remain comparable. Report the proportion selecting that association among valid respondents. Separate prompted recognition from unprompted recall, because being shown a name or statement changes the task.
Communities can also support Sizzle when people find a genuine reason to participate. For a healthcare organization, a community space needs clear boundaries, appropriate moderation, and careful handling of personal disclosures. A smaller space that delivers useful administrative information may be more valuable than a large audience with little trust or participation. Avoid assuming that growth in membership proves stronger brand relationships.
Sizzle is especially vulnerable to unsupported causal stories. A redesign, an advertising campaign, and a change in service quality may happen together. If confidence rises afterward, the design alone cannot automatically claim the improvement. Use the strongest available comparison, document concurrent changes, and describe the result with the level of certainty the evidence allows.
Worked example 1: improving an outpatient booking journey
Consider fictional Harborview Outpatient Centre. Its marketing and reception teams notice that many visitors start the online booking process but do not receive a confirmation. Staff also receive calls asking whether a request went through. The organization has capacity for the booking service being promoted, and its existing operational review processes determine what can be offered. The marketing project is limited to making the administrative journey clearer.
During a fictional four-week baseline, the relevant landing page receives 1,600 eligible sessions. Of those, 400 sessions start the booking flow and 180 reach a confirmed-booking event in the same session. The team defines a session consistently as a visit ending after 30 minutes of inactivity. It excludes test traffic and known automated traffic using documented rules. Each eligible session is counted once at each step, regardless of repeated clicks. Confirmations completed outside the session are reported separately rather than silently added to this rate. The booking-flow completion rate is therefore 180 divided by 400, or 45 percent. The landing-page confirmation rate is 180 divided by 1,600, or 11.25 percent.
The distinction changes the diagnosis. A poor landing-page confirmation rate could reflect irrelevant traffic or a confusing page. A weak completion rate among people who already started the flow points more directly toward the booking process. Neither figure, by itself, explains why people stopped. Some visitors may have been comparing options, checking availability, or choosing to telephone instead.
The team combines a review of anonymized administrative feedback with a small usability study. In this fictional investigation, people struggle to distinguish a request acknowledgement from a final confirmation. They also miss the location selector on a small screen. These are specific, testable problems. The response is to clarify status messages, improve the selector, and show a visible contact option when the flow cannot resolve a request.
The primary objective is to increase booking-flow completion from 45 percent to 60 percent by the end of an eight-week pilot, subject to adequate capacity and stable service quality. Serve is the main dimension because the project helps people complete an intended task. Sell is secondary because confirmed bookings are a relevant operational conversion. Speak supports the investigation, while Save remains a possible outcome to assess rather than an automatic claim.
The target implies 240 confirmations for every 400 comparable booking-flow sessions. The team labels it a planning target, not a forecast. Before launch, it checks whether the interface works on mobile, whether confirmation events fire only after a real confirmation, and whether errors offer a useful recovery route. It also sets guardrails for duplicate submissions, unresolved requests, and access to human help.
Suppose the final four-week measurement window of the fictional eight-week pilot records 220 confirmations from 400 comparable flow sessions. This window is compared with the four-week baseline, so the raw counts below cover equal durations. Completion is now 55 percent, an increase of 10 percentage points and a relative increase of approximately 22.2 percent. The target of 60 percent has not been reached. Reporting only that conversions grew by 22.2 percent would hide both the absolute rate and the missed target. A clear report shows the baseline, the new rate, the sample sizes, and the target together.
During the same hypothetical periods, total confirmed bookings across web and telephone rise from 300 to 325. Web confirmations increase from 180 to 220, while telephone confirmations fall from 120 to 105. The online increase is 40, but the all-channel increase is 25. This does not establish that the redesigned flow caused 25 additional bookings. It does show why online growth alone is an incomplete description of the result.
The team also records sessions containing at least one duplicate submission falling from 10 to 4 among the 400 flow sessions in each period, a decrease from 2.5 percent to 1 percent. Each affected session is counted once, rather than counting every repeated submission. That is promising operational evidence, but duplicates and sessions must retain the same definitions. A separate review checks unresolved cases and tests the flow with users of assistive technology. If a subgroup struggles more after the redesign, the aggregate improvement does not justify ignoring that problem.
The decision is to keep the clearer status messages, investigate the remaining exits, and avoid increasing campaign spend solely on the strength of this before-and-after result. A more controlled comparison may strengthen causal understanding if feasible. Even without a perfect experiment, the team has learned something practical: the initiative supports Serve, may contribute to Sell, and needs further evidence before claiming incremental growth or meaningful savings.
Worked example 2: building an administrative help hub
Now consider fictional Cedar Health Network. Its contact team repeatedly answers non-clinical questions about opening hours, accessible entrances, changing contact details through the approved account process, and finding the correct administrative department. Information exists across several pages, but wording and navigation differ. The team proposes a help hub with clearer categories and a visible route to a person when the answer is missing.
The primary dimension is Serve. The organization wants people to find an accurate administrative answer without unnecessary effort. Save is a secondary objective because repeated explanations consume staff time. Speak will help the team identify confusing topics, and Sizzle concerns whether the experience supports a brand association with clarity and responsiveness. Each dimension receives its own evidence rather than sharing a single page-view count.
For the fictional baseline, a task study gives 300 eligible attempts to locate specified administrative information. Participants succeed without assistance on 180 attempts, a task success rate of 60 percent. The study uses predefined success criteria and a range of devices. It is a test sample, not a census of every website visitor. The objective is to raise success to at least 75 percent in a comparable study after six weeks while maintaining a usable human contact route.
The proposed hub groups content by user task, uses plain titles, states when information was reviewed, and assigns an owner for each topic. Search results favor the maintained answer rather than old duplicates. The team removes unnecessary requests for personal details from general feedback and makes clear that the hub is for administrative information. Sensitive account matters continue through the organization’s existing appropriate channels.
Listening is deliberately narrow. After a task, participants can say whether they found the information and which part was unclear. Reception staff submit recurring administrative themes without patient identifiers. The content owner reviews those themes weekly and records whether each calls for a wording change, a navigation fix, or an operational correction. This creates a Speak loop with a decision at the end, rather than a growing folder of comments.
Suppose the fictional follow-up study records 228 successful attempts out of 300. Task success reaches 76 percent, exceeding the stated 75 percent target. The report still checks whether the tasks, recruitment, device mix, and success criteria were comparable. If the second study used easier tasks or recruited more experienced visitors, the apparent gain would be less persuasive. Results from a controlled task study also cannot be assumed to describe every live interaction.
For Save, the network separately compares 600 similar staff-handled administrative requests in each measurement period. Average handling time falls from eight minutes to six minutes. Baseline handling requires 80 hours; the later period requires 60 hours. The gross reduction is 20 hours. This comparison holds request volume constant to isolate handling-time arithmetic; it makes no claim that the hub eliminated a particular number of calls.
The team then adds the new work. In the fictional later period, maintaining the hub takes nine hours, additional training takes three hours, and extra escalation handling takes four hours. These activities are counted separately from the six-minute handling-time measure, so they are not deducted twice. Net released time is four hours. That is a much smaller result than the initial 20-hour headline, but it is more useful for planning.
If an illustrative loaded staff cost is 30 dollars an hour, four hours correspond to 120 dollars of notional capacity value. The organization has not necessarily saved 120 dollars in cash. Staff may instead use that time to answer difficult questions. Any software charges and one-off implementation costs must also be included before making a financial return claim. A project can be worthwhile for Serve even when its short-term Save contribution is modest.
For Sizzle, a separate fictional feedback sample asks whether the administrative website makes the organization seem clear and easy to deal with. The team reports the percentage selecting that statement among valid respondents and publishes the sample size internally. It does not use a change in page traffic as a substitute for this question. Nor does it claim that the hub caused a brand change if the sample or other service conditions changed at the same time.
The final decision considers the whole result. Stronger task success supports continuing the hub, while the small net time release argues against an ambitious cost-saving claim. Unanswered questions become the next content priorities. A human contact route remains available because unusual circumstances are part of the service, not evidence that users have failed to follow instructions.
Turn the framework into a practical operating plan
Begin with the situation rather than a list of channels. Review the organization’s purpose, current service constraints, audience tasks, existing performance, and recurring sources of friction. Decide which problem matters enough to address now. The course’s emphasis on justified and hierarchical objectives is useful here: a marketing objective should follow from evidence and support a larger organizational goal.
Next, write one objective sentence with an audience or task, a baseline, a desired change, and a deadline. Add the relevant S and explain why it fits. If a baseline is missing, the first commitment may be to establish one using a defined method. Inventing a precise improvement percentage without understanding current performance makes the plan look complete while leaving its central assumption unsupported.
Choose a primary outcome measure and a small set of supporting measures. The primary measure tells the team whether the objective is being achieved. Supporting measures explain mechanisms and reveal tradeoffs. For example, task success may be primary, while completion time, repeat contacts, and unresolved requests help explain whether a change genuinely improved the experience. A useful dashboard should support a decision, not display every available number.
Create a short measurement definition for each metric. Specify the numerator, denominator, unit of analysis, time window, exclusions, source, and responsible owner. Explain how repeat visits, duplicate records, missing consent, and incomplete responses are handled. Where the available data cannot support a conclusion, preserve that uncertainty in the report rather than filling the gap with a confident assumption.
Select tactics only after the objective and evidence are clear. The same Serve objective might call for rewriting a page, improving search, simplifying a form, or training staff to use a consistent explanation. The choice depends on the cause of the problem, resources, and operational constraints. A familiar channel is not automatically the right response, and a sophisticated tool is not automatically a better one.
Plan implementation and review together. Assign a content owner, an operational owner, a measurement owner, and an escalation route. Decide how errors will be detected, who can pause a problematic change, and what evidence would justify expanding it. Review intervals should match the volume of usable data and the seriousness of the potential downside. Low-volume services may require more time before a rate change becomes interpretable.
At review, make a concrete decision: continue, revise, investigate, scale cautiously, or stop. An unchanged result is still information if the measurement is sound. A mixed result deserves a mixed explanation. A project can improve Serve while failing to deliver Save, or increase Sell while creating unacceptable service pressure. The framework is most valuable when it helps the team acknowledge that reality and choose the next step responsibly.
Keep the limits visible
The 5S framework does not prove causation, choose an ethical tradeoff, or certify compliance. It helps people ask better questions about objectives. Statistical methods, operational knowledge, accessible design, privacy review, and relevant professional judgement remain necessary where the task requires them. Nothing in the framework guarantees a particular commercial or service result.
It also cannot repair unreliable data. Changing event definitions midway through a pilot, combining incompatible denominators, or presenting self-selected feedback as representative can make a weak result appear strong. Document limitations early and use proportionate measurement. Collect only the information needed for the decision, restrict access appropriately, and avoid sending sensitive healthcare or account information into general marketing analytics.
Finally, resist the temptation to distribute effort evenly across all five dimensions. A small team may need to concentrate on one important service problem this quarter. The course requires an objective to serve at least one S; that does not mean every campaign must promise five kinds of success. Choose the value that matters, make the objective measurable, test the mechanism, and report both the improvement and its costs. That is how 5S becomes a useful management tool rather than another set of labels.
Sources and course connection
This article develops the 5S model presented in the supplied Digital Marketing Strategy course explanation, physical PDF pages 59, 61, 66, and 68. Page 59 sets objective criteria; page 61 specifies the course’s SMART wording; page 66 explains PR Smith’s five dimensions; page 68 connects a SMART objective with a baseline, target, time frame, and relevant S. The healthcare examples, implementation guidance, and calculations above are original teaching applications, not examples or reported results from the course.
PR Smith, SOSTAC planning: Objectives. The creator’s public explanation confirms Sell, Serve, Speak, Save, and Sizzle and the accompanying SMART requirement. Checked 19 October 2026.
Comments
No published comments yet.