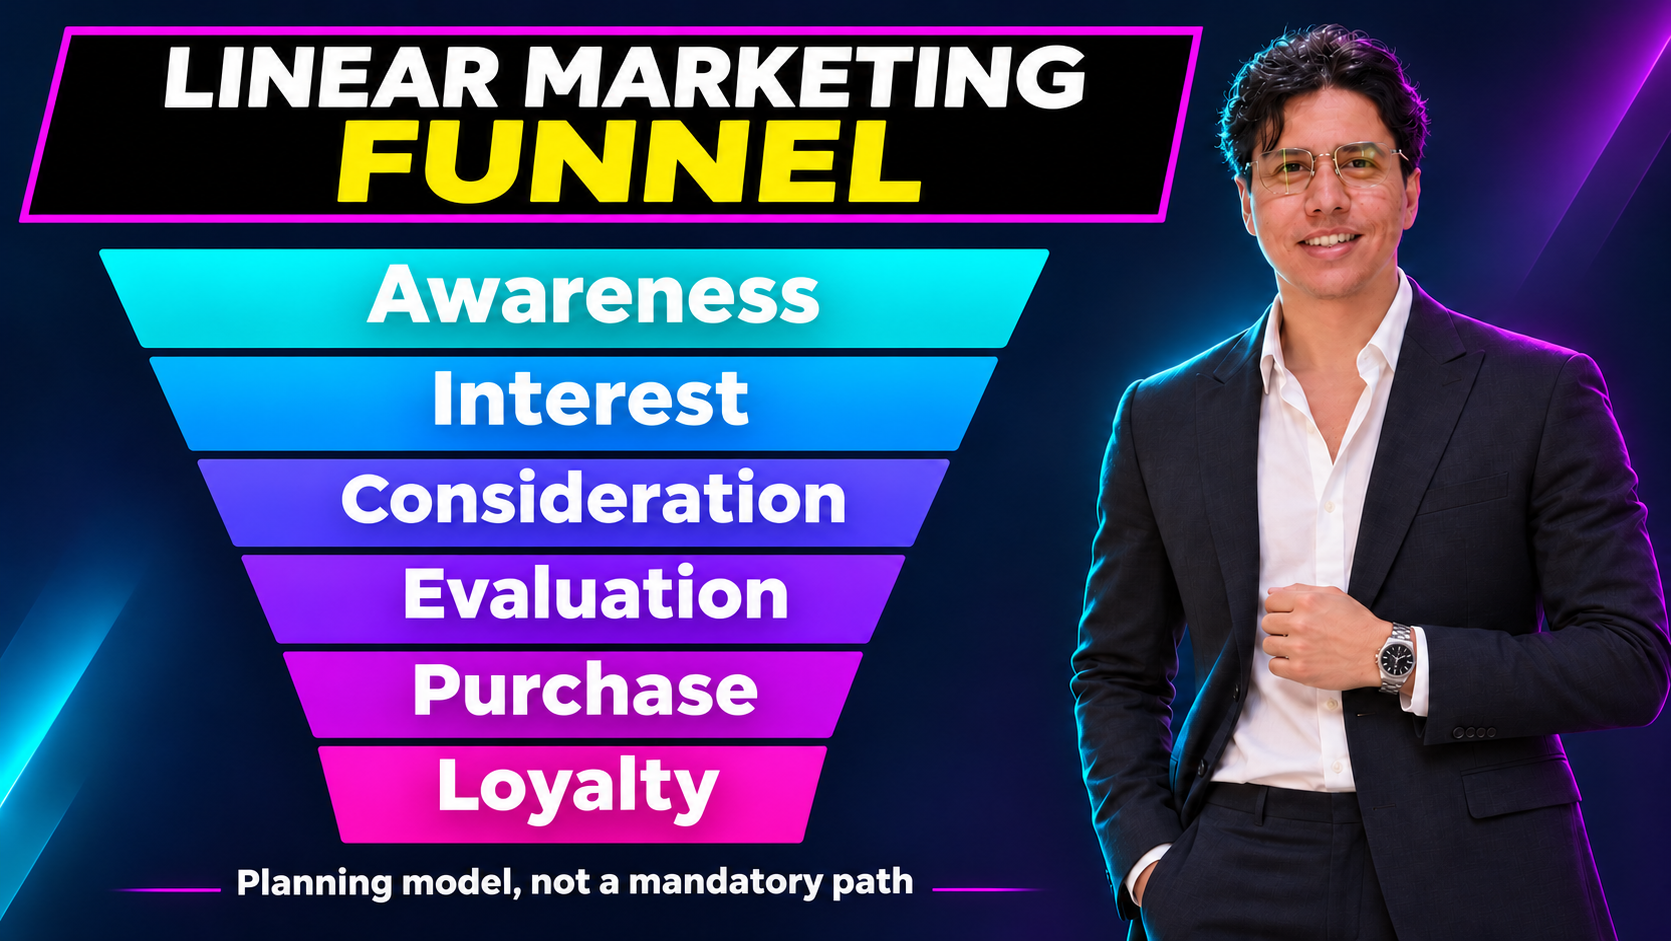
The linear marketing funnel is a planning map that organizes what a customer needs from discovering an offer through purchase and then loyalty. The version used in this lesson has six stages: awareness, interest, consideration, evaluation, purchase, and loyalty. Its value is in revealing content gaps, unclear responsibilities, or stalled transitions between defined steps. It does not prove that people move in a straight line, make every click evidence of a psychological stage, or automatically turn large advertising reach into sales.
Imagine a team running good advertisements and receiving many enquiries, but not knowing why conversations stop before an order. One person suggests increasing reach, another proposes a discount, while the real problem may be that customers cannot find an answer about whether the product fits their use case. The funnel allows a more precise question: what does this person need at this point, and what evidence shows that need is unmet? We will use it to organize the answer, then build measurement and a test that distinguish a hypothesis from a result.
The source of this version and the limits of its attribution
This lesson draws on physical pages 151 and 152 of the uploaded “Introduction to Digital Marketing” course material. The first page presents a six-stage funnel, while the second presents a different map allocating channels across awareness, consideration, purchase, retention, and advocacy. We do not merge the two diagrams into one funnel or treat their different labels as an error to conceal. The first organizes the progression of messaging and decision-making; the second illustrates where channels and content can serve the journey.
Both slides refer to Email on Acid's article on customer journey map examples, published February 18, 2021. The source presents several map formats and discusses the usefulness and limits of simplification. This lesson does not present the six-stage version as the only universal standard or as a verified invention by a particular person. Names and divisions vary with purpose. The reference provides context for the course material; the examples, calculations, and implementation plan below are original teaching developments, not published company results.
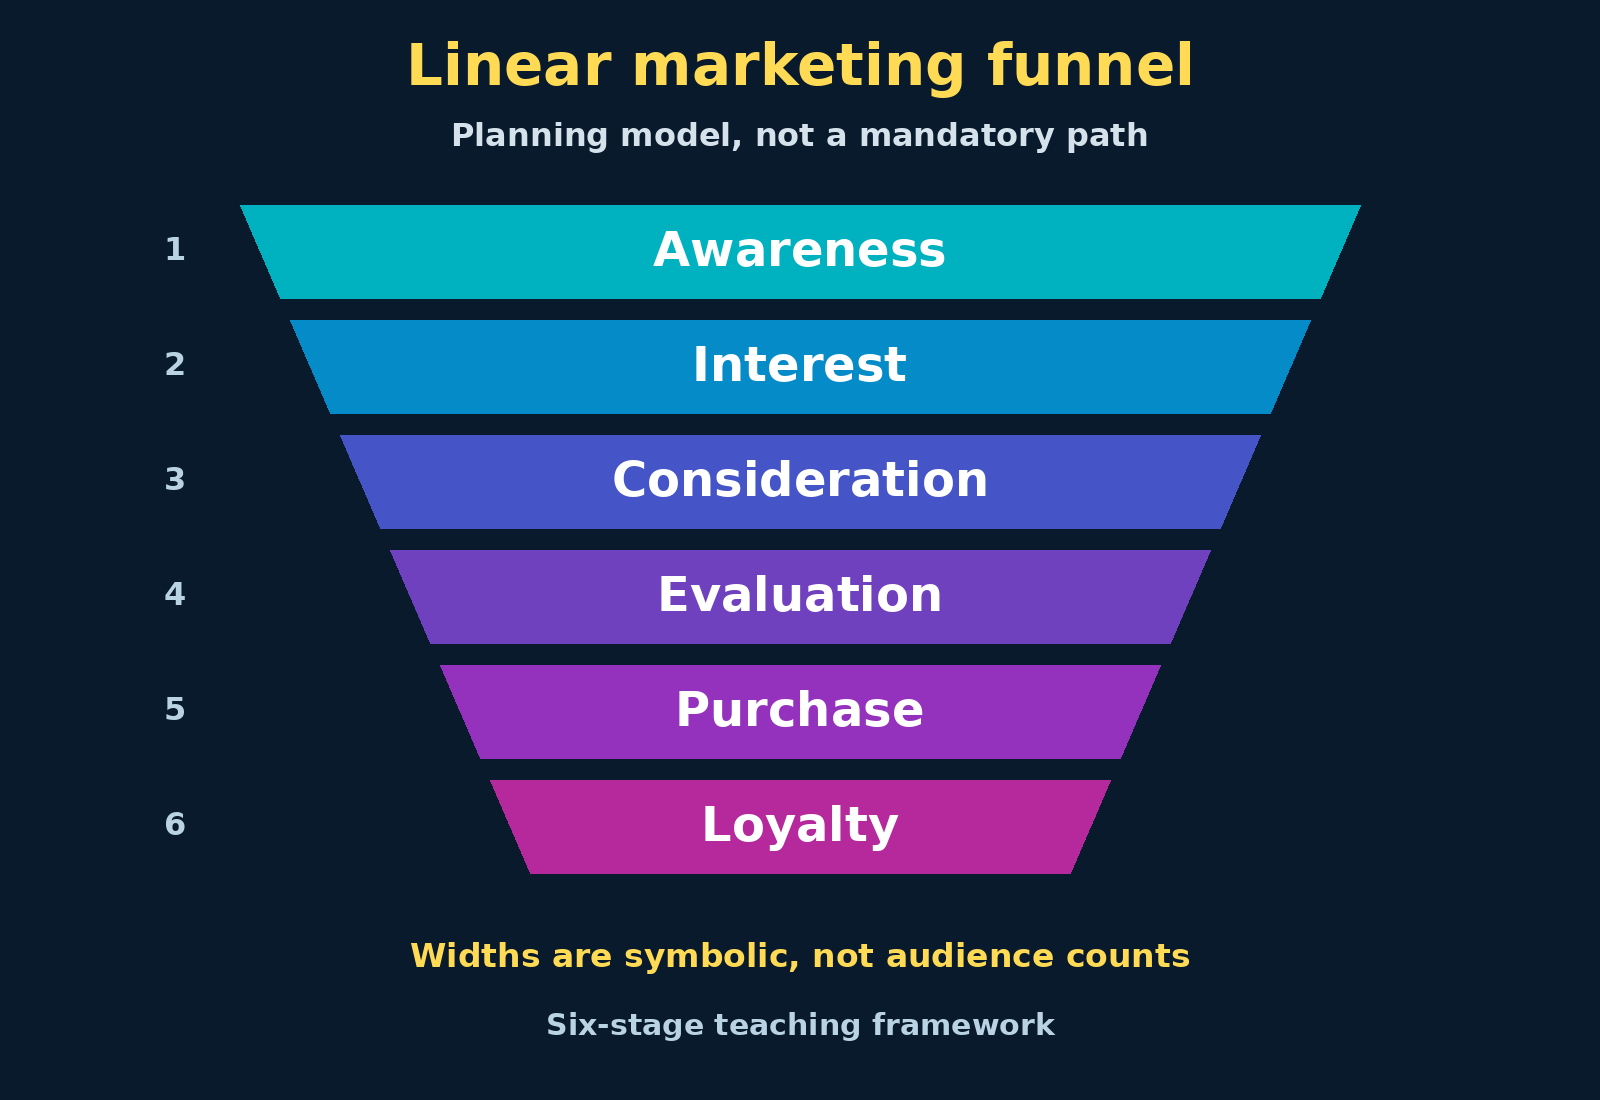
What does the narrowing shape mean, and what does it not mean?
A wide top and narrow bottom are a metaphor suggesting that fewer people may complete a particular path. But the conceptual illustration is not a chart of actual counts, and its layer widths must not be measured to derive percentages. If you want to show data, state the count, counting unit, period, and source, and visually separate those data from the model. Otherwise, readers may interpret an explanatory shape as verified analysis of organizational performance.
It is also inappropriate to put advertising impressions at the top, visitors in the middle, and customers at the bottom, then calculate ratios between them without explaining the changing unit of counting. A person may see an advertisement many times and visit from multiple devices. They may also buy directly through another channel that your tools do not record. Good measurement therefore starts by defining the observed path, rather than assuming we see every person's entire journey.
Stage one: awareness of a clear promise, not just a name
Awareness in this lesson means that the relevant audience knows the offer exists and understands its connection to a recognizable need. Not every advertisement impression creates knowledge, and remembering a logo does not prove understanding of the service. When an organization says it provides integrated solutions, readers may remember the phrase without knowing whom those solutions were designed for. Write a message whose understanding can be tested: whom do we serve, in what situation, and what value can we deliver and substantiate?
Suitable content may briefly explain a use problem, show a clear visual example, or answer a common question. Every post does not need every detail, but it must not begin with a misleading promise later corrected by small-print conditions. If the product requires a particular device or the service is available at a specific branch, do not let the advertisement imply universal availability. Early clarity improves the quality of interest, even if it reduces some unsuitable clicks.
To measure this stage, distinguish estimated reach, recall measured appropriately, and campaign-generated visits. Each means something different. You can test what participants understood from an advertisement without telling them the desired answer, then use the findings to improve the message. Do not attribute every subsequent sales change to awareness alone, especially when prices, stock, or distribution change during the same period.
Stage two: interest through an answerable question
After discovering the offer, a person may want to know more. The practical question becomes: “Does this relate to my need?” Provide a small, useful next step rather than jumping to a long form that requests extensive information before explaining the basics. That step might be reading an example, watching a short explanation, voluntarily selecting an area of interest, or exploring service types. The choice depends on what the audience needs, not what is easiest to collect in a database.
Do not treat a click or time on page as conclusive evidence of genuine interest. The user may have clicked accidentally, left the page open, or been looking for a job rather than a product. Name the event accurately: “opened the usage guide” or “visited the details page.” Then acknowledge that interpreting it as interest is a hypothesis. This separation prevents weak assumptions from accumulating into a supposedly definitive customer classification.
In email, you can invite subscribers to select the topics they want instead of inferring everything from behavior. Subscription and preference messages should be clear, and preferences easy to change. Do not automatically increase pressure because messages are ignored. The need may have changed, or the timing may no longer suit the person. The quality measure here is useful engagement with less unwanted contact, not the highest possible number of messages sent.
Stage three: consideration and evidence of suitability
Consideration means your offer becomes a serious option worth examining, not merely an interesting subject. Help people at this stage by explaining use cases, limitations, requirements, and expected cost or how it is determined. Do not require a booked call simply to reveal basic information you can publish accurately. If cost genuinely varies, explain the factors that affect it and what the customer will receive before making a commitment.
A service page can be built around practical questions: whom does it suit, what does it include and exclude, what preparation is required, and what alternatives exist when it is unsuitable? These questions do not undermine selling. They prevent a mismatch from turning into a post-purchase complaint. If a simpler version is sufficient for a particular case, say so. Pushing everyone toward the highest-priced option may briefly raise order value while distorting the measurement of choice quality.
Test suitability using multiple forms of evidence: customer questions, review of reasons for not continuing, and short usability tasks. Do not conclude that price is the obstacle merely because someone left the pricing page. Missing details, incompatible appointment times, or confusing options may be responsible. Each explanation calls for a different intervention, so the observation and assumed cause must remain separate in the improvement record.
Stage four: evaluation through fair comparison
Customers now examine alternatives and ask which best meets their criteria. Compared with consideration, the comparison is more specific: one feature against another, total cost against value, or delivery time against a need. Show verifiable information and define the comparison basis. Do not compare an inclusive package's price with the price of one item, or hide differences in contract duration, support level, or mandatory charges.
A unique value proposition helps when it connects to a real need and can be substantiated. “The best service” does not explain a difference, while a defined support scope or documented compatibility gives customers information they can weigh. If you mention a competitor, verify their information and its date, and do not attribute unsubstantiated shortcomings to them. You do not have to win every comparison criterion. The person needs to understand where your offer fits and where another option may fit better.
Reviews can add context, but are not a substitute for specifications or a guarantee of similar results. Do not invent testimonials or take an opinion out of context. Clearly label examples from hypothetical projects as hypothetical. Quality indicators at this stage include fewer questions caused by ambiguity or fewer unsuitable orders, not merely more clicks on the most expensive package.
Stage five: purchase as delivery of the promise
A person may reach a suitable decision but fail to complete it because of a technical step or late information. Check the form, payment, and confirmation on mobile and in the available languages. Does the customer know what will be requested before starting? Do they understand the price, charges, and fulfillment method? Does the success message accurately reflect what happened? Requesting a quotation is not a purchase, and requesting an appointment is not final confirmation if later human review is required.
The course material includes order confirmation and after-sales service within this stage. Good implementation starts with a confirmation containing necessary information, rather than overwhelming customers with another offer before they know their order's status. A complementary product may be suggested when relevant, clear, and optional, but do not make an add-on preselected or confusing. Increasing transaction value does not justify hiding costs or making refusal harder than acceptance.
Monitor reasons for completion failure instead of combining them into one abandonment figure. A payment-method error, unavailable stock, rejection of a condition, and a move to the telephone channel are not the same situation. Record available categories using the minimum necessary data, and check recording accuracy. If the tool cannot distinguish those causes, do not invent a detailed breakdown in the report. State the limitation and design appropriate evidence collection.
Stage six: loyalty after an experience worth returning to
Loyalty is not a button that appears after payment. Customers need to receive what was promised, understand its use, and obtain appropriate support when they encounter difficulty. Plan what they should know on day one and during the first week, as appropriate to the service, without turning the schedule into a mandatory message sequence. Sometimes a good help page and a clear contact route are more valuable than a weekly newsletter that adds nothing.
Do not automatically equate repeat purchasing with loyalty. People may return because of satisfaction, habit, or limited options. They may not return because the product lasts a long time or their need has ended. Define an appropriate opportunity to return before measuring it, and monitor satisfaction, complaints, and cancellation difficulty separately. Do not treat trapping customers in an unclear subscription as successful retention, or pressure them to publish a positive review in return for service they are entitled to receive.
In healthcare particularly, success is not measured by increasing unnecessary visits and tests. Communication, appointments, and administrative clarity can be improved, while clinical suitability and medical follow-up are determined by qualified professionals. Do not use health details to create advertising audiences or call a marketing activity a treatment plan. This is a design boundary in the healthcare example below, not a patient assessment or medical recommendation.
Channels serve stages but do not own them
Page 152 gives channel examples: advertising for introduction, reviews and content for comparison, the website, call center, or store for completing the decision, and a knowledge base and newsletters for the ongoing relationship. These are allocation examples, not exclusive rules. Video can explain usage after purchase, a call-center employee can answer an introductory question, and email can carry confirmation or educational content according to its purpose.
We therefore build a matrix with stages as rows and columns for the question, content, channel, owner, and observed event. If several channels perform the same function while leaving an important question unanswered, the problem is not necessarily too little publishing, but poor allocation. If pricing information differs across channels, the repair starts with the source of truth used by the teams, not with designing a new post.
The map also clarifies the distinction between retention and advocacy in the course material's second example. A customer can stay without publicly recommending the brand, or recommend it once without buying again. Do not combine these into one metric or require customers to act as promoters. Recommendation is a choice, and public sharing may reveal information someone does not want to disclose, especially when it concerns a personal service.
First hypothetical example: a short training-course funnel
All figures below are educational, not results from a real course. Suppose an organization offers inventory-management training for small retailers. It uses introductory content explaining the problem without promising to double profits. It then provides a sample lesson for interest, a syllabus and requirements page for consideration, and a comparison of self-directed and supported learning for evaluation. At purchase, it explains dates, price, and cancellation policy; afterward, it sends access instructions and provides learning support.
We do not invent numbers for every mental stage. We select an observed path for one cohort of 1,000 unique eligible people who entered the course page during a defined period, with an equal follow-up opportunity for each. Of these, 300 opened the sample lesson; 150 of those proceeded to the program page; 60 of those started registration; and 48 completed it. This is a defined event sequence, not proof that every registrant at the organization followed it. Purchasers who used another route are reported separately.
The sample-lesson opening rate among entrants is 30%; progression to the program page among lesson openers is 50%; registration starts among program-page viewers are 40%; and registration completion among starters is 80%. The overall rate for this path is 48 out of 1,000, or 4.8%. It can be checked by multiplying the rates: 0.30 × 0.50 × 0.40 × 0.80 = 0.048. Nested denominators and the same period must be maintained for this multiplication to be meaningful.
The largest numerical loss is before the sample lesson opens, but this is not necessarily the best investment opportunity. Some visits may be unsuitable in the first place, and increasing that transition may be costly. For scenario analysis only, suppose clearer requirements raise registration starts from 40% to 50%, with all other factors held constant. The arithmetic result becomes 1,000 × 0.30 × 0.50 × 0.50 × 0.80 = 60 registrations, or 12 additional registrations. This is a sensitivity assumption, not a guaranteed forecast or a test result.
After learning begins, track attendance, self-reported benefit, technical problems, and refunds. If registrations rise but withdrawals increase because the course level was misunderstood, choice quality is flawed. Attendance is not proof of skill mastery, and every refund is not a marketing failure. Connecting post-purchase indicators to the funnel prevents improvement at the beginning from coming at the expense of the experience at the end.
Second hypothetical example: organizing a healthcare appointment request
Suppose a clinic wants to improve administrative clarity for appointment requests without promoting a particular diagnosis or treatment. At awareness, it explains the type of service and location; at interest, it answers approved general questions; and at consideration, it explains the professionals, approved costs, and appointments. At evaluation, it helps people understand what booking includes and what requires a question to the team, without claiming one provider suits everyone or a patient's opinion guarantees a result.
For training only, suppose there are 240 valid appointment requests after duplicates and incomplete requests are removed under a stated definition. Successful contact is made with 180; appointments are confirmed for 120 of those; and 96 attend among appointments due within equivalent observation windows. The contact rate is 75%; confirmation among those contacted is approximately 66.7%; attendance among confirmed appointments is 80%; and attendance per valid request is 40%. Do not mix these denominators or call all of them the booking rate.
If delayed appointment confirmation is the problem, test clearer request status and expected response timing while monitoring confirmation accuracy and duplicate bookings. Do not add unlimited reminders or send health details to general measurement tools. Exclude from this analysis matters that must be handled through the approved clinical pathway, and do not use the funnel to make a clinical decision. Improved administrative attendance does not prove better treatment outcomes, because this example does not measure them.
Automation: explicit rules rather than silent assumptions
Before building any automated sequence, document its entry and exit conditions and what happens when a customer buys, withdraws consent, or changes their need. Choose a verifiable event rather than a vague label such as “hot lead.” A message may need a delay to allow an order update to arrive, or suppression when contact transfers to a human team. Stop rules are part of the design, not a correction added after complaints.
Test the sequence with test accounts and ordinary and exceptional cases: someone who buys quickly, someone who asks to stop, someone who registers twice, and someone who never receives a message. Do not test by sending real messages to customers who have not consented to that purpose. Keep a record of what was sent and why, with appropriate access and limited data. Technical ability to send a message does not mean sending it is useful or permitted.
It helps for each message to have one function and point to up-to-date information. If an offer changes, review old messages that may continue automatically. A funnel can look complete in a presentation while its automation refers to an expired price or an unavailable branch. The plan therefore needs an owner for content maintenance and another for the accuracy of customer states, not just a copywriter on launch day.
Why not treat the actual journey as a straight line?
A person may return from evaluation to research, an existing customer may go directly to purchase, or someone may recommend the brand before buying personally. The lesson on McKinsey's consumer decision journey examined previous experience and changes in the set of alternatives. Here, linearity organizes content functions and limited measurement, rather than denying those movements or returning every customer to the top of the funnel at every visit.
For an organizational purchase involving a user, buyer, and technical manager, do not merge their roles into one person moving sequentially. One person may assess suitability while another reviews the budget at the same time. Map role-specific paths and handoffs when needed. A simple funnel helps in an introductory meeting, but cannot replace a more detailed map when relationships and responsibilities become complex.
Sometimes the problem lies outside marketing: an offer that does not meet the need, unavailable stock, or operational capacity that cannot support demand. Increasing funnel entrants in that situation may increase complaints rather than growth. Include capacity limits in the test plan, and ensure the proposed improvement can be delivered without service deterioration. Lower demand is not always a loss if it prevents promises the organization cannot keep.
An economic review before choosing a bottleneck
Not every increase in customer numbers has the same value or cost. Before selecting a stage to improve, ask about the cost of implementing the change, capacity to serve additional demand, and the quality of the resulting customers. Improving an explanatory page may require limited work, whereas reducing waiting time may require recruitment or reallocating appointments. Do not compare percentages alone without understanding the required resources, or move budget to a channel simply because it produced the last recorded interaction.
In the course example, suppose a teaching price of SAR 500 per registration. The 12 additional registrations in the sensitivity scenario would mean SAR 6,000 in hypothetical gross sales before refunds, costs, and possible taxes. This is not profit or a guaranteed return. The additional places may require more support, and some registrations may replace sales that would have arrived through another route. Separating sales from profit and from genuine incremental impact prevents a result from appearing larger than the evidence supports.
Nor should the largest percentage drop automatically become the priority. A transition from ten people to two looks weak, but may represent appropriate filtering of unsuitable requests or a small, highly variable sample. A transition from 1,000 to 700 may conceal a larger numerical problem with a different cost. Rank opportunities by potential impact, confidence in the evidence, feasibility, and risk, then begin with a limited test rather than a management promise unsupported by measurement.
Add a clear section to the report on what was not measured: effects from other channels, unlinked telephone orders, seasonal changes, or delayed refunds. You do not need a lengthy apology for every limitation. You need to explain what the decision can rely on now and what requires more information. A useful report neither hides gaps nor stops because of them. It identifies the step that can reduce uncertainty at the lowest reasonable cost.
Practical exercise: building a diagnostic funnel in two weeks
Start by choosing one offer and a defined use-case audience, then collect common questions and available events from authorized sources. Do not begin by choosing a new tool. Write six rows corresponding to the lesson's version, with the customer's question, existing content, and assumed gap beside each. Mark what you know from direct evidence, what you infer, and what you do not know. This prevents gaps from becoming a coherent but inaccurate story.
Next, choose one obstacle you can test without changing the whole offer. Form a hypothesis specifying the audience, change, outcome, and guardrail. For example: “Explaining requirements before registration will reduce incompatibility enquiries without increasing withdrawals caused by an error in how the offer is presented.” Define how you will identify the cause, who will collect the data, and how long the outcome needs to mature. Do not select a success threshold after seeing the numbers.
Implement the change at an appropriate scale, and inspect tracking early to ensure events are not duplicated and groups are comparable. Do not stop the test at the first attractive increase or extend it only because the result is unwelcome. If the sample cannot support a firm conclusion, state that. Interviews can help explain obstacles, but do not mix their qualitative findings with a statistical estimate of the improvement rate.
Finish with a decision sheet stating what changed, what did not, what you learned, and what remains unknown. If an intermediate event improves but the final outcome does not, investigate the next step rather than declaring complete success. If purchases improve while refunds or complaints worsen, do not conceal the trade-off. The funnel's practical lesson is that every transition is a responsibility that can be examined, and journey quality is measured by the promise delivered, not merely the number reaching the last box.
Sources and attribution
- Uploaded “Introduction to Digital Marketing” course material, physical pages 151–152: the source for the six stages and the channel-allocation example. The text and both diagrams were read; the original illustrations were not copied and their structures were not merged into a single model.
- Email on Acid: Customer Journey Map Examples: What’s Your Style?, February 18, 2021: a contextual reference cited by the course material, presenting different map formats and their limits. We do not rely on a historical attribution from it to establish who invented the six-stage version.
- The course and clinic examples, calculations, scenarios, and test plan above are original hypothetical teaching material, not actual performance by Karim or any organization, or medical guidance.
Comments
No published comments yet.